What do the sections between the lines on the phase diagram below represent?
1 Answer

Aug 10, 2017
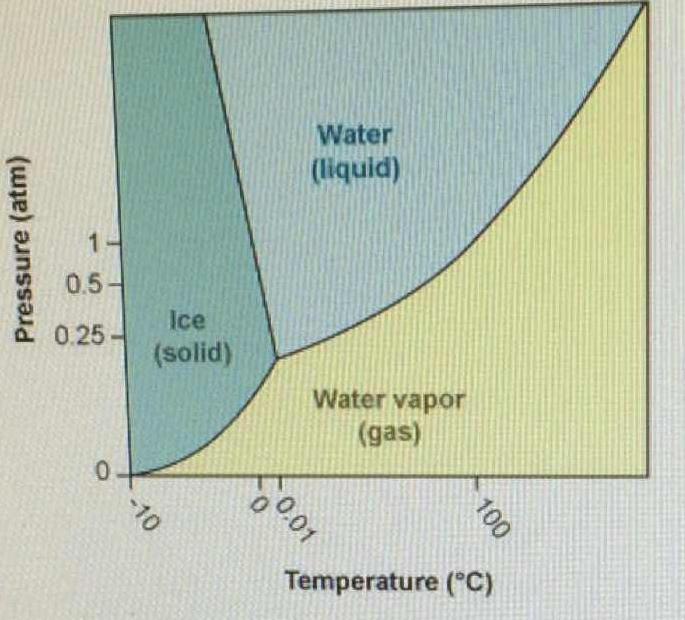
The way I interpret this graph is the range of factors/conditions that influence states of matter of water to change.
The lines simply represent the border between each state.
For example, for water to be in a solid state, the temperature can vary from
The independent variable corresponds to the dependent variable.
Hope this helps :)
