How do you graph y=3sin(x-pi/4)+2?
1 Answer


Explanation:
This a scaling and translation of the basic
It is being scaled by a factor of three, then translated (moved) 2 up and
First look at the graph of sin:
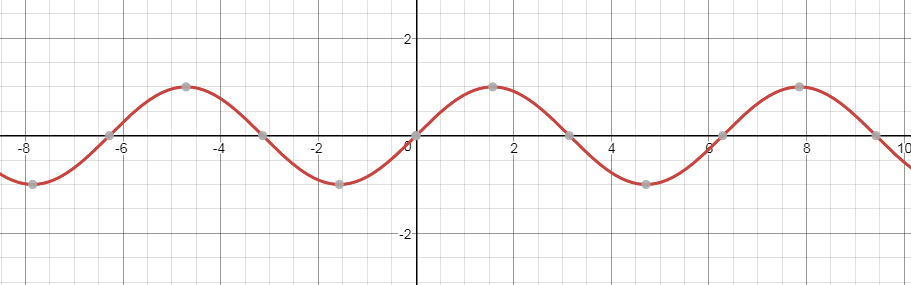
Points to note are that it goes through the origin (0,0) and goes up to 1, and down to -1. It crosses the
I have used the Desmos graphing tool to produce these graphs. I'm afraid I've not been able to change the
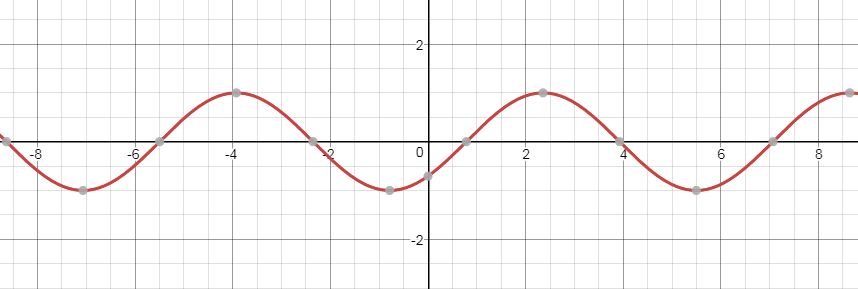
The first step I've done is to move the graph
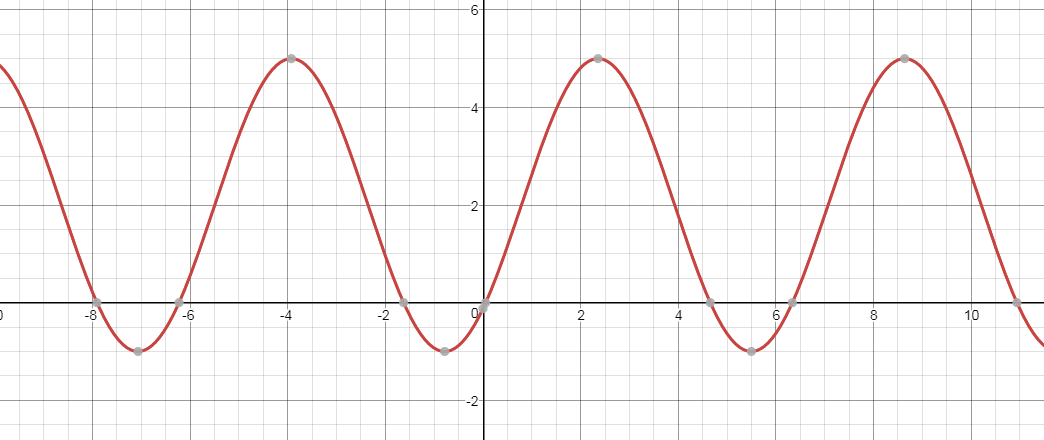
Next, I've scaled it by a factor of 3, which means that it instead of going between 1 and -1, it will be between 3 and -3. Please note that the graph still crosses the
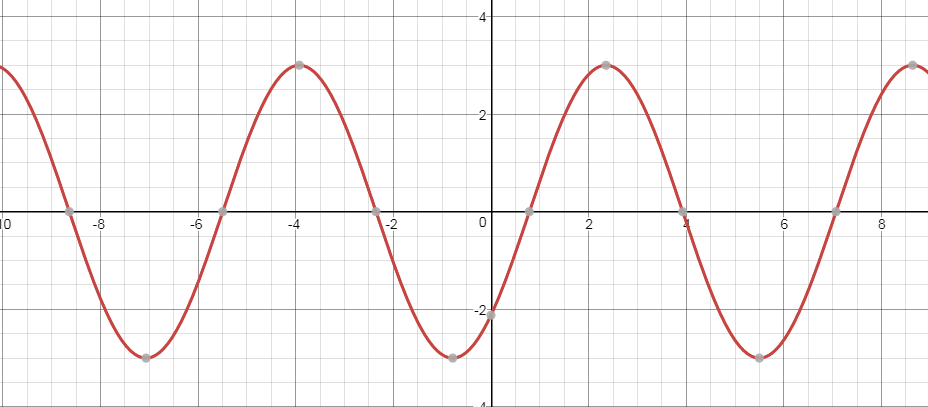
Finally, the graph needs to be moved 2 up and this gives you the final answer: