Question #37a3d
1 Answer

Explanation:
I’m going to use desmos.com to show what is going on, but you could do this by hand on graph paper as well:
Change the first two constraints so that they are inequalities of lines in slope intercept form:
We know the other constraints keeps us between 0 and 8 on the x-axis, while also not letting us go below 0 on the y-axis.
So this is what the graph looks like on Desmos: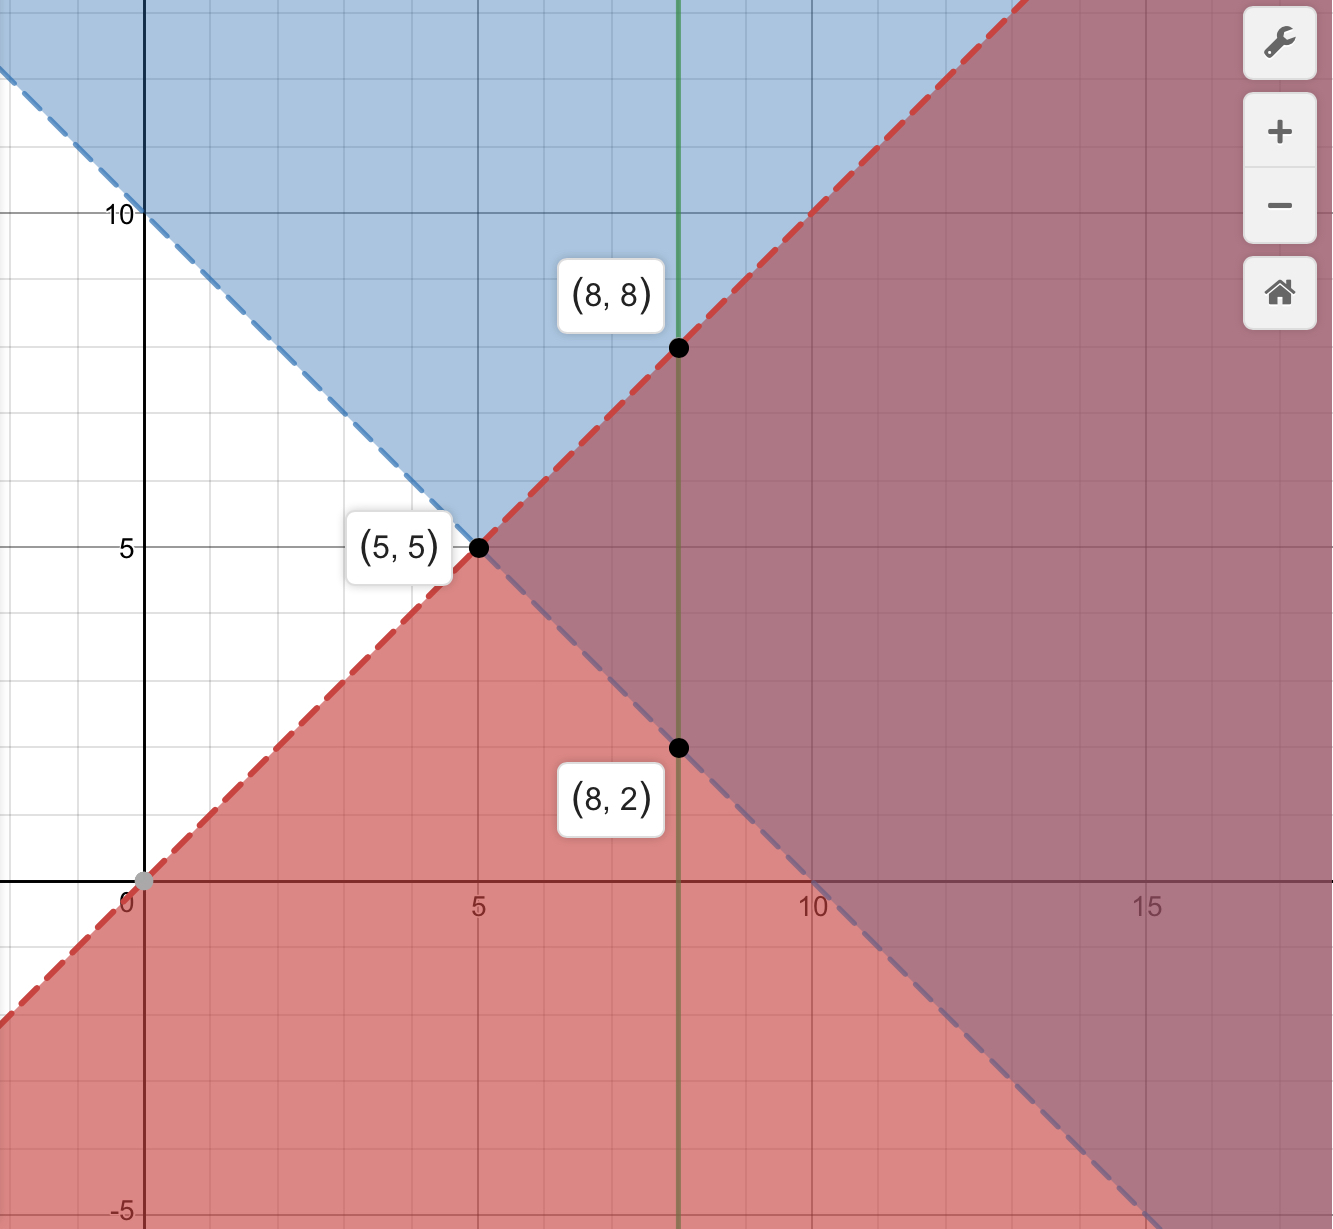
We can see the region we care about is the triangle that is contained in the first quadrant. This region has 3 vertices that could maximize our function
Let’s try each point with the function
Thus the point
