What is the Hertzsprung-Russell diagram and why is it so important to astronomy research?
2 Answers


Explanation:
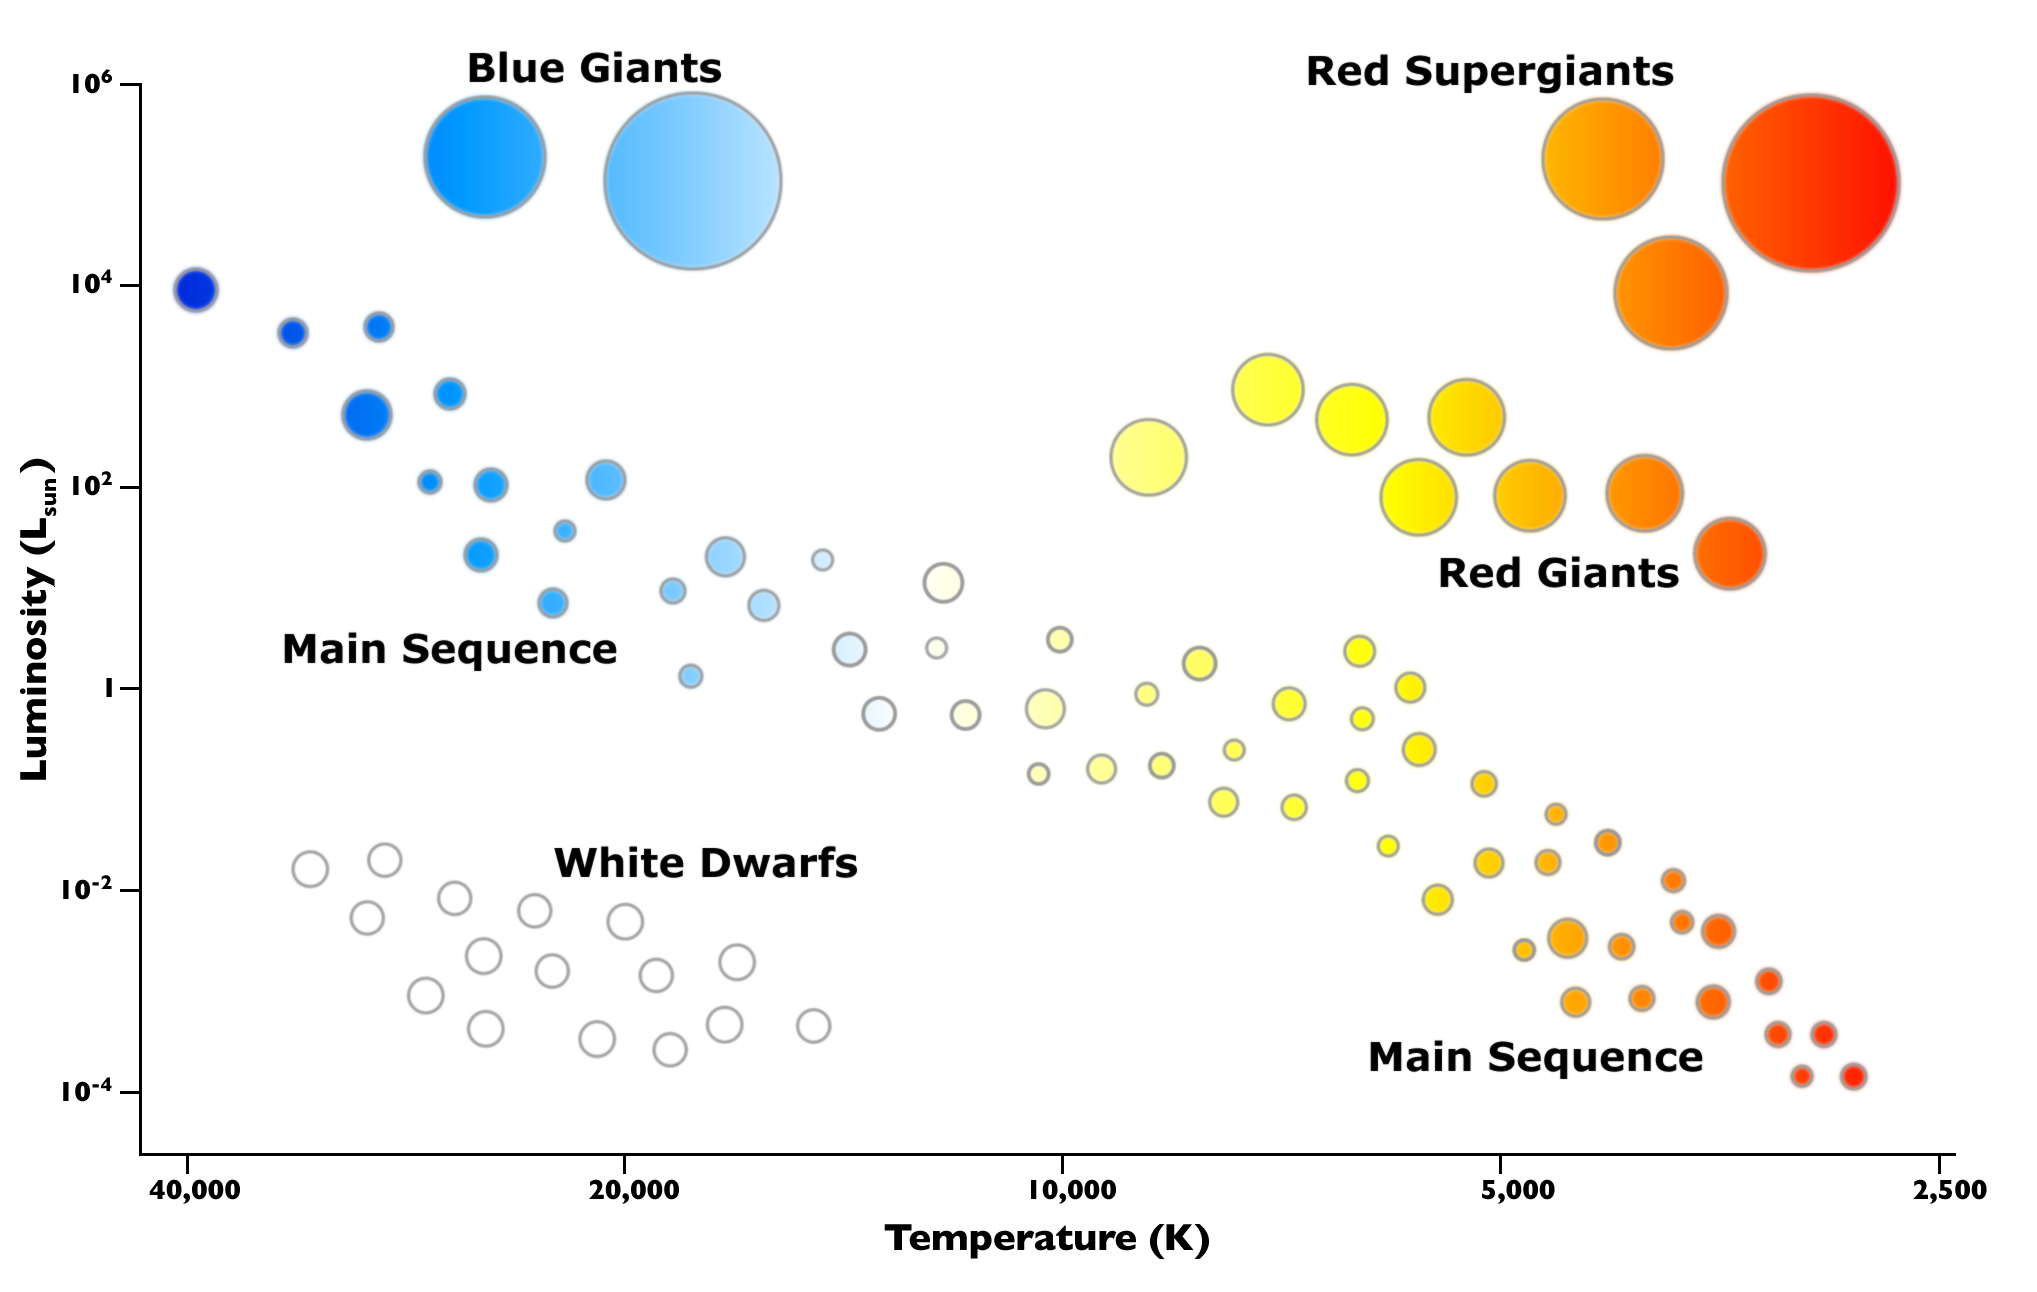
The Hertzprung-Russell diagram is a graph relating stars' temperature to their luminosity. The graph has 5 main regions, each for a different group of stars.
The Main Sequence contains your average, run-of-the mill stars for which luminosity is related directly to temperature. Main Sequence stars tend to be in the beginning or middle of their lives, when the pressure outwards from the heat of nuclear fusion in their cores still balances out the inward force of gravity.
Red Giants and Supergiants are older small- and medium- size stars that have bloated, and are therefore more luminous even though they aren't very hot. White dwarfs have blown off their outer layers and are super hot, but not very luminous because they are so small. Blue giants are just massive, and don't live very long.
The H-R diagram is important because stars can be classified by their placement on it.

Just worth mentioning how much effect this diagram had on the field of astrophysics?
Explanation:
At the time (start of the 20th century) the only two observable features of stars were their brightness and colour, which was associated with the temperature. Plotting these against each other yielded nothing:
From: 
Their genius was to realise that the effect of distance was dominant, and that what was needed was to work out the absolute brightness I.e. brightness of a star at a set distance. Then suddenly the correlation appeared and the field of astrophysics took off - generalisations were possible.
