How would you use the phase diagram of water to explain why ice at the bottom of a glacier can melt when the rest of the glacier which is the same temperature remains solid?
2 Answers
Phase diagram won't really help.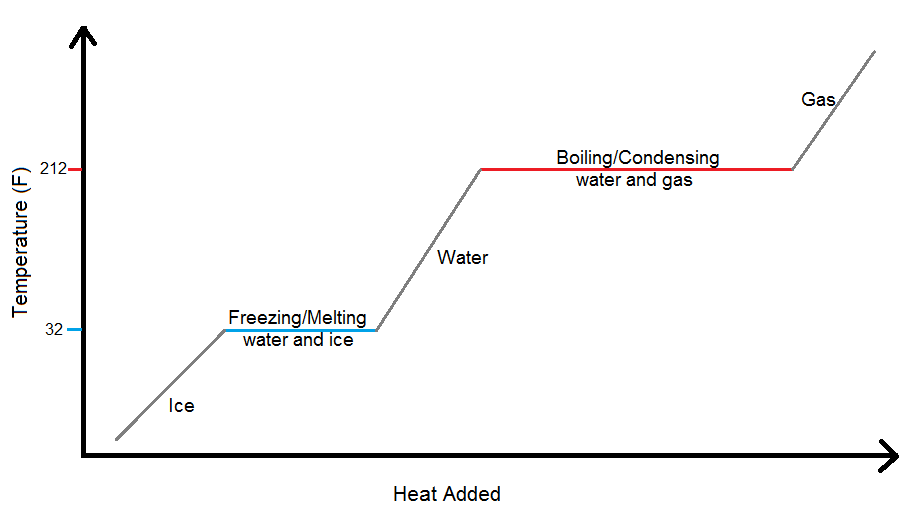
Explanation:
When something changes its state of matter (formally, a phase change), regardless of whatever it is, it remains at it's melting point/boiling point/freezing point UNTIL all of it has changed its state of matter.
So, to clear up, ice and water can both exist at 0°C at 1 atmosphere. The difference is that water has more energy than ice does, therefore solid water can break up the bonds and become a liquid.
I heavily suggest you take a look at calorimetry, it explains it greatly and is related to your question. :)
Well, first we need a phase diagram....and we ain't got one here....
Explanation:
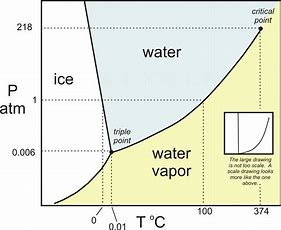
Now here pressure is plotted against temperature, and the transition between liquid and solid and gas is mapped out....And reasonably at high pressure and low temperature, we gots a solid phase ice, and at high temperature and low pressure we gots a gas....(i.e. water vapour).
Now look at the interface between ice and water.....the slope is NEGATIVE...
And now we introduce the Clapeyron equation for phase equilibria....
Looking at the slope of the transition between ice and water, we gots a NEGATIVE slope (in fact the slope is exaggerated somewhat...)....and this is clearly the differential
And since
And so finally to your question.....under a regime of HIGH PRESSURE, i.e. at the bottom of the glacier, the melting point of the ice is REDUCED with respect to its melting point at
