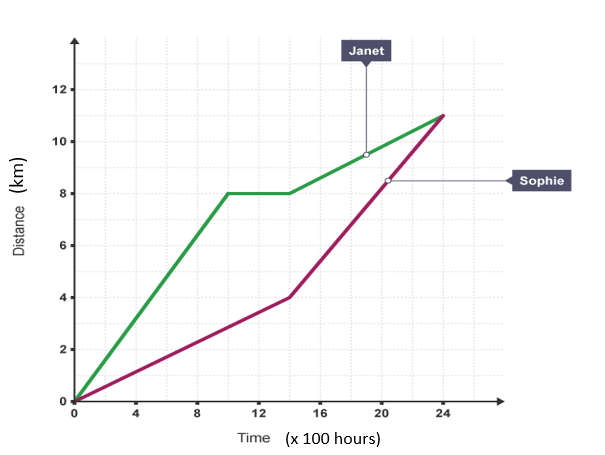
What does the following graph tell us about Janet and Sophie's journey?
1 Answer
Jan 27, 2018
Please see below.
Explanation:
The graph is given below:

Janet and Sophie started their journey together. Janet walked faster than Sophie from the beginning itself (as shown by steeper slope), but after walking for
After
Sophie decided to increase the pace and and was able to catch up with Janet after
