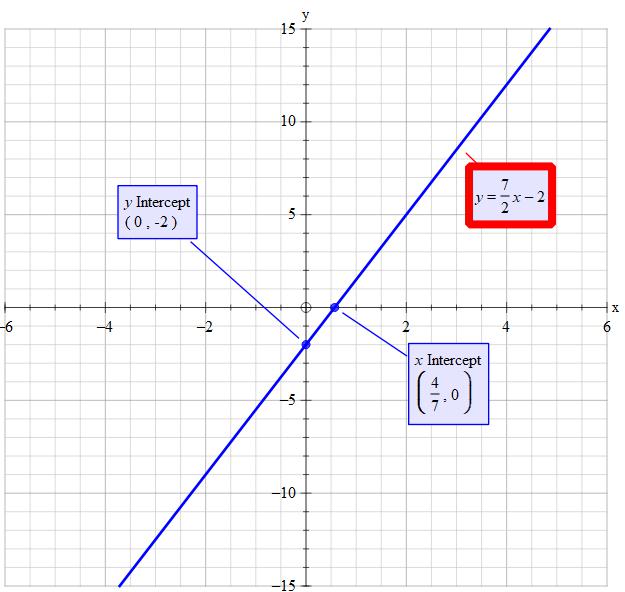
How do I graph 7/2x-2?
2 Answers
First, I'm not sure if this is supposed to be read as
or
So we will plot both.
THE LINE
The function is in slope intercept form. We know that at
THE INVERSE FUNCTION
We will plot this by transforming it relative 1/x. We know what 1/x looks like. We can think: what does 1/(2x) look like?
For 1/x to get to 1/2, we need to plug in two but in order to get to 1/2 with 1/(2x), we only need to plug in one, so it is shrinking twice as fast! However, we also have the 7 up top which slows down the shrinking by the same logic and makes it ultimately be slower falling than 1/x.
Then we have the -2, which shifts the whole function downward by 2.
Assumption: you mean:
see explanation.
Explanation:
NOT USING SHORTCUT METHODS
This is an equation of a straight line
Set:
If you multiply 0 by 2 you still end up with 0. Lets 'get rid' of the 2 from
Add 4 to both sides
Divide both sides by 7
~~~~~~~~~~~~~~~~~~~~~~~~~~~~~~~~~~~~~~
Set
~~~~~~~~~~~~~~~~~~~~~~~~~~~~~~~~~~~~~~
DRAW A STRAIGHT LINE THROUGH THOSE POINTS.
Make sure you label your points and put a title on the graph.
Example: Graph of
 )
)

