How do you graph y+4x=1?

1 Answer
May 2, 2018

y+4x=1

y=-4x+1

enter image source here

y=-4*(-5)+1=21
y=-4*(-2)+1=9
y=-4*(0)+1=1
y=-4*(2)+1=-7
y=-4*(5)+1=-19

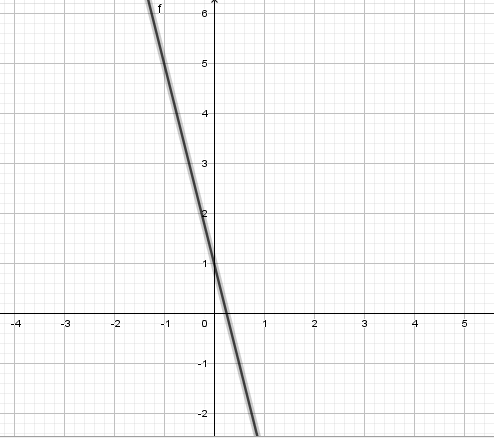
We can now draw a line through the coordinates,
(-5,21), (-2,9), (0,1), (2,-7), (5,-19)

enter image source here

Explanation:

Let everything y should be equal to on one side. Giving,

y=-4x+1

From there, make a table for your calculations. One for x values and the other for what y gives after replacing the x values with numbers.

Since x can be anything, and will go on infinitely. We can make up numbers to what x can be at certain times. In the table above, I have chosen x to be -5, -2, 0, 2, 5 and seen what happen when I replaced these numbers with x in y=-4x+1.

One calculation will for example be,
y=-4*(-5)+1=21
Which basically means that when x=-5 the y-axis will be at 21.

Another is ,
y=-4*(2)+1=-7
Which means that when we choose x=2 we will get a point on the y-axis being -7.

This is something we can see on the graph above too. For example, when x=0 then y=1.

Since this is a straight line, we would basically just need to points to draw our line between and out from. Since this line goes on to the infinite.