What other thermodynamic properties besides temperature and pressure may be graphed in phase diagrams?
1 Answer

TYPICAL PHASE DIAGRAMS
Consider water's
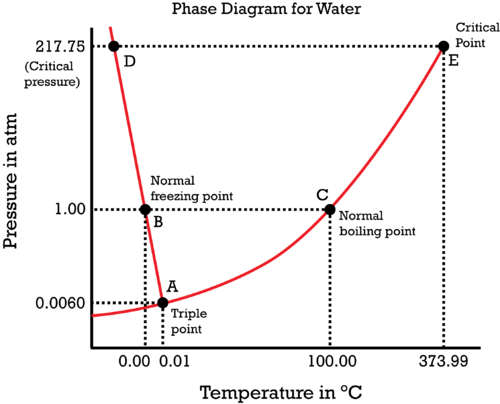
Here we have:
- Equilibrium (coexistence) curves, where two phases coexist.
- A triple point, where three phases coexist.
- A critical point, where the liquid and vapor phase become a single superfluid phase.
Phase transitions would occur simply by crossing a curve, and while it is going on, you are still on the curve itself.
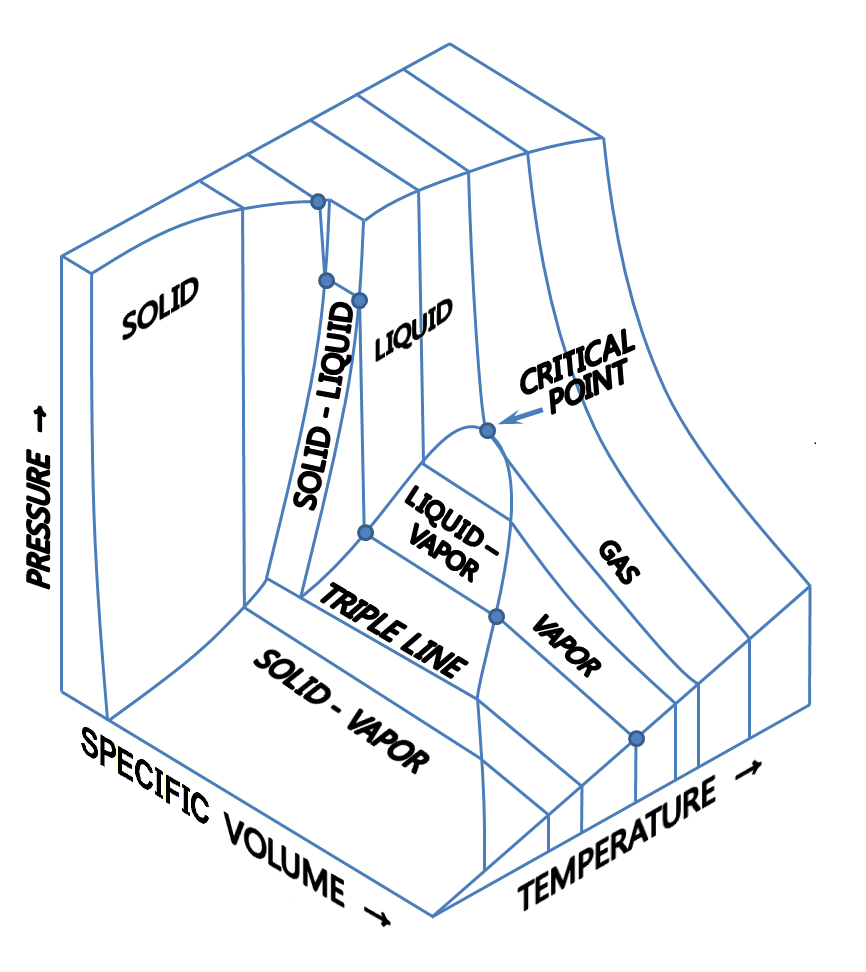
PV PHASE DIAGRAMS
A common alternative is a
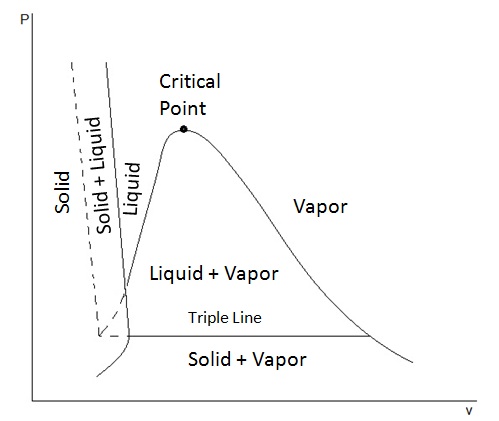
[Here, temperature IS a variable, but it extends out of the page, like a
Unlike in the usual
- There are equilibrium regions (instead of equilibrium curves).
- There is a triple line (instead of a triple point).
- The critical point lies on a double-valued curve (instead of at the end of a single-valued curve).
A phase transition from liquid to vapor starts from the righthand intersection above the triple line and ends on the descending curve to the right.
This clearly shows the increase in molar volume at constant pressure (and temperature) while vaporizing, as it should.
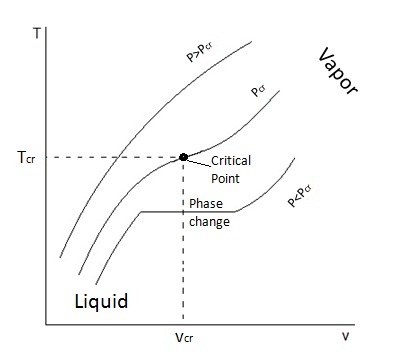
- The starting point of the transition marks a solution to the appropriate equation of state for the molar volume of the liquid.
- The ending point of the transition marks a solution to the appropriate equation of state for the molar volume of the gas.
This kind of graph finds more use by graphing the liquid-vapor curve at various temperatures to find the critical natural variables:
The solid horizontal line is the aforementioned vaporization phase transition.
When the cubic curve in the middle coalesces into a flat central slope, we have the critical temperature
This derivation of the constants
A
As you may see, in the second
