Organize the functions from the least to greatest according to their y-intercepts.?

enter image source here

2 Answers
Jun 19, 2018

#color(blue)(g(x),f(x),h(x)#

Explanation:

First #g(x)#

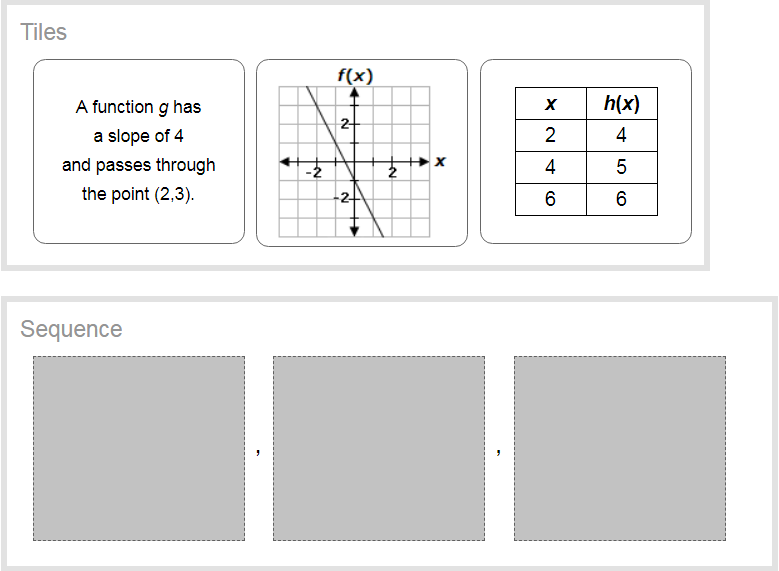
We have slope 4 and point #(2,3)#

Using point slope form of a line:

#(y_2-y_1)=m(x_2-x_1)#

#y-3=4(x-2)#

#y=4x-5#

#g(x)=4x-5#

Intercept is #-5#

#f(x)#

From the graph you can see the y intercept is #-1#

#h(x)#:

Assuming these are all linear functions:

Using slope intercept form:

#y=mx+b#

Using first two rows of table:

#4=m(2)+b \ \ \[1]#

#5=m(4)+b \ \ \[2]#

Solving #[1]# and #[2]# simultaneously:

Subtract #[1]# from #[2]#

#1=2m=>m=1/2#

Substituting in #[1]#:

#4=1/2(2)+b=>b=3#

Equation:

#y=1/2x+3#

#h(x)=1/2x+3#

This has a y intercept of #3#

So from lowest intercept to highest:

#g(x),f(x),h(x)#

Jun 19, 2018

same as displayed

Explanation:

the equations for all linear functions can be arranged into the form #y = mx + c#, where

#m# is the slope (gradient - how steep the graph is)
#c# is the #y#-intercept (the #y#-value when #x = 0#)

'a function #g# has a slope of #4# and passes through the point #(2,3)#'.

we know that #m = 4#, and that when #x = 2#, #y = 3#.

since #y = mx + c#, we know that for this function #g#, #3 = (4*2) + c#

#3 = 8 + c#

#c = 3 - 8#

#c = -5#

hence, #c# (the #y#-intercept) is #-5# for the graph of #g(x)#..

-

next shown is the graph of #f(x)#.

the #y#-intercept can be seen here, as the #y#-value at the point where the graph meets the #y#-axis.

reading off the scale for the #y#-axis (#1# per square), you can see that #y = -2# when the graph meets the #y#-axis.

hence, #c = -2# for the graph of #f(x)#.

-

the table of values for the function #h(x)# give the #y#-values at #x = 2, x= 4# and #x = 6#.

we see that for each time #x# increases by #2#, #h(x)# or #y# increases by #1#.

this is the same pattern for decrease.
since #x = 0# is a decrease of #2# from #x =2#, we know that the value of #y# at #x = 0# is #1# less than #y#'s value at #x = 2#.

the #y#-value at #x = 2# is shown to be #4#.

#4 - 1 = 3#

when #x = 0#, #h(x) = 3#, and #y = 3#.

hence, #c = 3# for the graph of #h(x)#.

-

so we have

#c = -5# for #g(x)#
#c = -2# for #f(x)#
#c = 3# for #h(x)#

these are in order from smallest to largest, so the sequence should be the same as in the pictures.