How do you graph y=4sin(x-pi/3)+2?

1 Answer
Aug 11, 2018

enter image source here

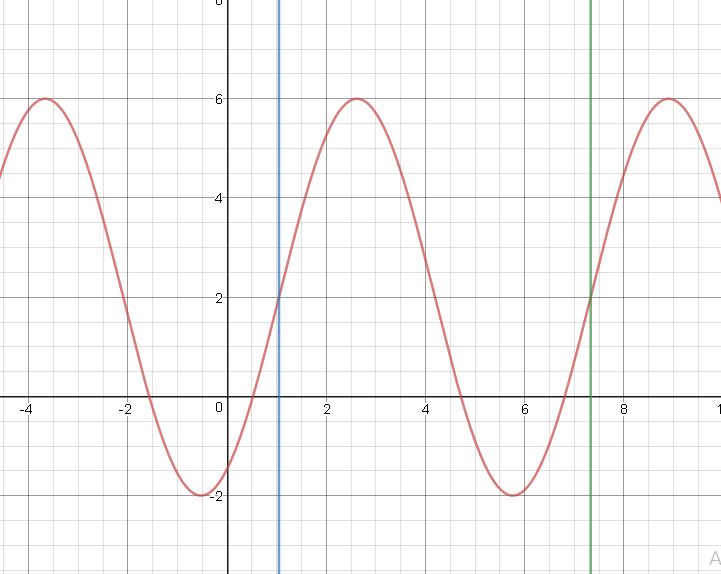
Note: The two vertical lines are one period of the function placed at x=pi/3 and x=(7pi)/3. Don't include the vertical lines when you graph it yourself, they are just visual aids.

Explanation:

First you must know the graph of the sin function.
graph{sinx [0, 6.282, -5, 5]}

Next find the amplitude, period, phase shift, and vertical shift.

Amplitude: 4 (function is four times higher
period: 2pi (nothing to change here)
phase shift: pi/3 to the right (change start point to the right pi/3)
vertical shift: up 2 (shift the start point from (pi/3,0 to pi/3,2)

Summary of translations: This is a sin function that has been shifted over pi/3 so one period of the function will go from pi/3to (7pi)/3 (side note: (7pi)/3 = (2pi+pi/3)). each point on the graph is multiplied by 4, because that is our amplitude. And it has been shifted up two units.