Graphing Power Functions
Key Questions
-
TLDR:
Long version:
If the exponent of a power function is negative, you have two possibilities:
- the exponent is even
- the exponent is odd
The exponent is even:
#f(x) = x^(-n)# where#n# is even.
Anything to the negative power, means the reciprocal of the power.
This becomes#f(x) = 1/x^n# .
Now let's look at what happens to this function, when x is negative (left of the y-axis)
The denominator becomes positive, since you're multiplying a negative number by itself an even amount of time. The smaller#x# is (more to the left), the higher the denominator will get. The higher the denominator gets, the smaller the result gets (since dividing by a big number gives you a small number i.e.#1/1000# ).So to the left, the function value will be very close to the x-axis (very small) and positive.
The closer the number is to#0# (like -0.0001), the higher the function value will be. So the function increases (exponentially).What happens at 0?
Well, let's fill it in in the function:
#1/x^n = 1/0^n#
#0^n# is still#0# . You're dividing by zero! ERROR, ERROR, ERROR!!
In mathematics, it is not allowed to divide by zero. We declare that the function doesn't exist at 0.
#x=0# is an asymptote.What happens when x is positive?
When
#x# is positive,#1/x^n# , stays positive, it will be an exact mirror image of the left side of the function. We say the function is even.Putting it all together
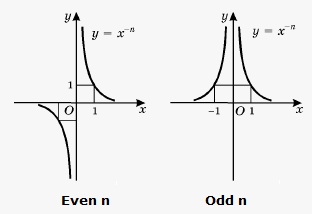
Remember: we have established that the function is positive and increasing from the left side. That it doesn't exist when
#x=0# and that the right side is a mirror image of the left side.With these rules the function becomes:
What about an odd exponent?
The only change with an odd exponent, is that the left half becomes negative. It is mirrored horizontally. This function becomes:
Hope this helped!
 Nico Ekkart
·
2
·
Dec 18 2014
Nico Ekkart
·
2
·
Dec 18 2014
-
A power function estimates a function using polynomials. Assuming the power series converges then as we add more and more terms to the series and increases the order then we estimate with increasing accuracy the function.
 Steve M
·
1
·
Jan 1 2018
Steve M
·
1
·
Jan 1 2018
-
The power function is defined as
#y = x^R# .
It has a domain of positive arguments#x# and is defined for all real powers#R# .1)
#R = 0# . Graph is a horizontal line parallel to the X-axis intersecting the Y-axis at coordinate#Y = 1# .2)
#R = 1# . Graph is a straight line going from point#(0,0)# through#(1,1)# and further.3)
#R > 1# . Graph grows from point#(0,0)# through point#(1,1)# to#+oo# , below the line#y = x# for#x in (0,1)# and then above it for#x in (1,+oo)# 4)
#0 < R < 1# . Graph grows from point#(0,0)# through point#(1,1)# to#+oo# , above the line#y = x# for#x in (0,1)# and then below it for#x in (1,+oo)# 5)
#R = -1# . Graph is a hyperbola going through point#(1,1)# for#x = 1# . From this point it is diminishing to#0# , asymptotically approaching the X-axis for#x rarr +oo# . It is growing to#+oo# , asymptotically approaching the Y-axis for#x rarr 0# .6)
#-1 < R < 0# . A hyperbola similar to the one for#R = -1# going below the graph of function#y=x^-1# for#x>1# and above it for#0 < x < 1# .7)
#R < -1# . A hyperbola similar to the one for#R = -1# going above the graph of function#y=x^-1# for#x>1# and below it for#0 < x < 1# .The power function
#y = x^R# with natural#R# can be defined for all real arguments#x# . It's graph for negative#x# will be symmetrical relative to the Y-axis to a graph for positive#x# if the power#R# is even or centrally symmetrical relative to the origin of coordinates#(0,0)# for odd power#R# .Negative integer values of
#R# can be used as a power for all non-zero arguments#x# with the same considerations of graph symmetry as above.For more details please refer to Unizor lecture about the graph of a power function following the menu items Algebra - Graphs - Power Function.
 Zor Shekhtman
·
1
·
Nov 23 2014
Zor Shekhtman
·
1
·
Nov 23 2014