How would a graph of pressure versus volume appear for a given quantity of gas?
1 Answer

Nov 19, 2016
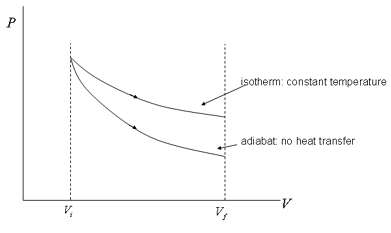
Boyle's Law was:
PV = "const"
so if one plots
P = "const" * 1/V
 http://apcentral.collegeboard.com/
You can see that it resembles
graph{1/x [-10,-10, -5, 5]}
If
Similarly, it is impossible to have a volume of
