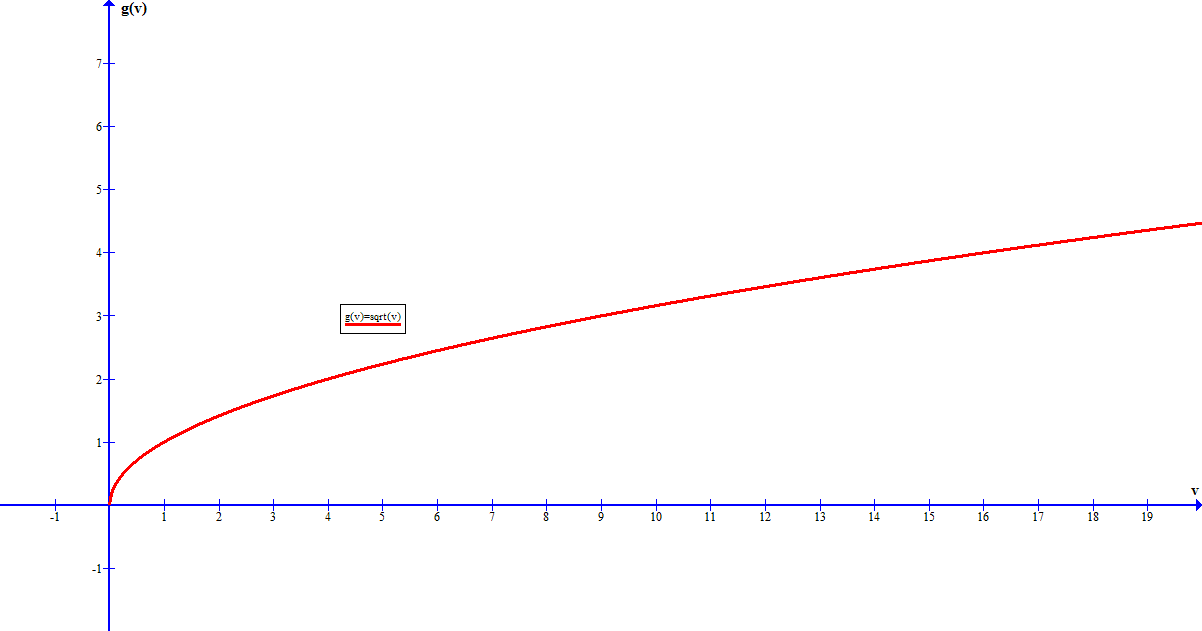
Start with the simpler function #g(v)=sqrt(v)#
Hopefully you will know the graph for this function, but if not the following table should give you some points that you can use to sketch it:
#color(white)("XXX"){:(ul(v),color(white)("xx"),ul(g(v))),(0,,0),(1,,1),(2,,4),(3,,9),(4,,16):}#
The graph should look like:
If we replace #v# with #(x+1)# then the only effect this has on our graph is to shift the #g#-axis.
#color(white)("XXX"){:(ul(x),color(white)("xx"),ul(v),color(white)("xx"),ul(g(v)),color(white)("xx"),ul(g(x+1))),(-1,,0,,0,,0),(0,,1,,1,,1),(1,,2,,4,,4),(2,,3,,9,,9),(3,,4,,16,,16):}#
which would give a modified graphic form:
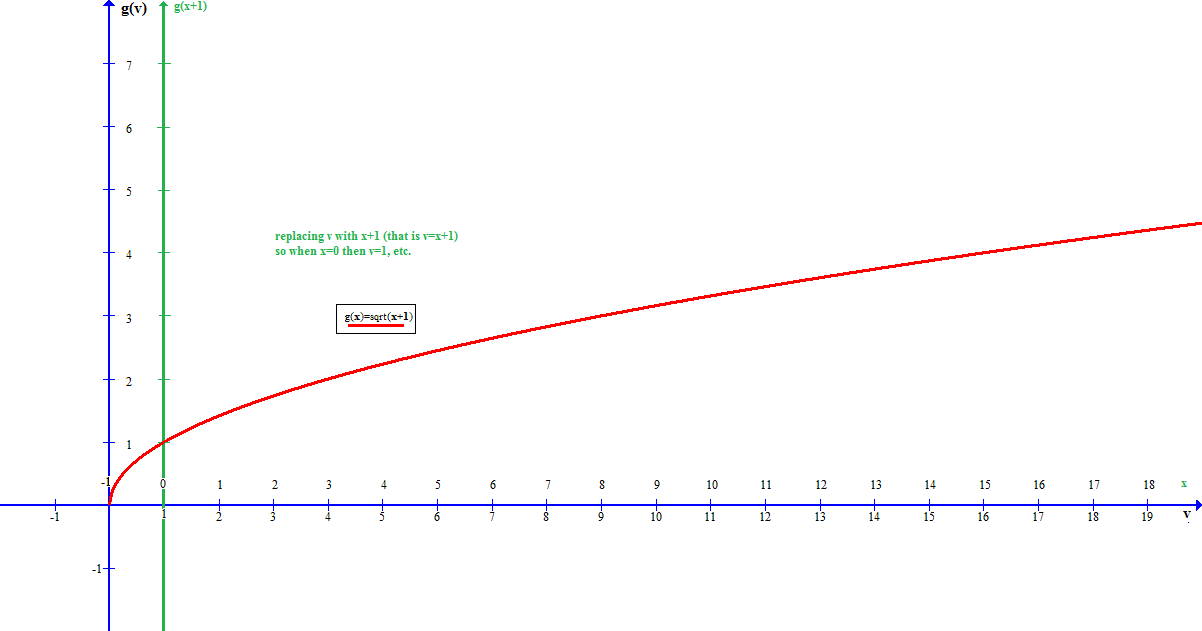
(Note that the actual curve has not changed.)
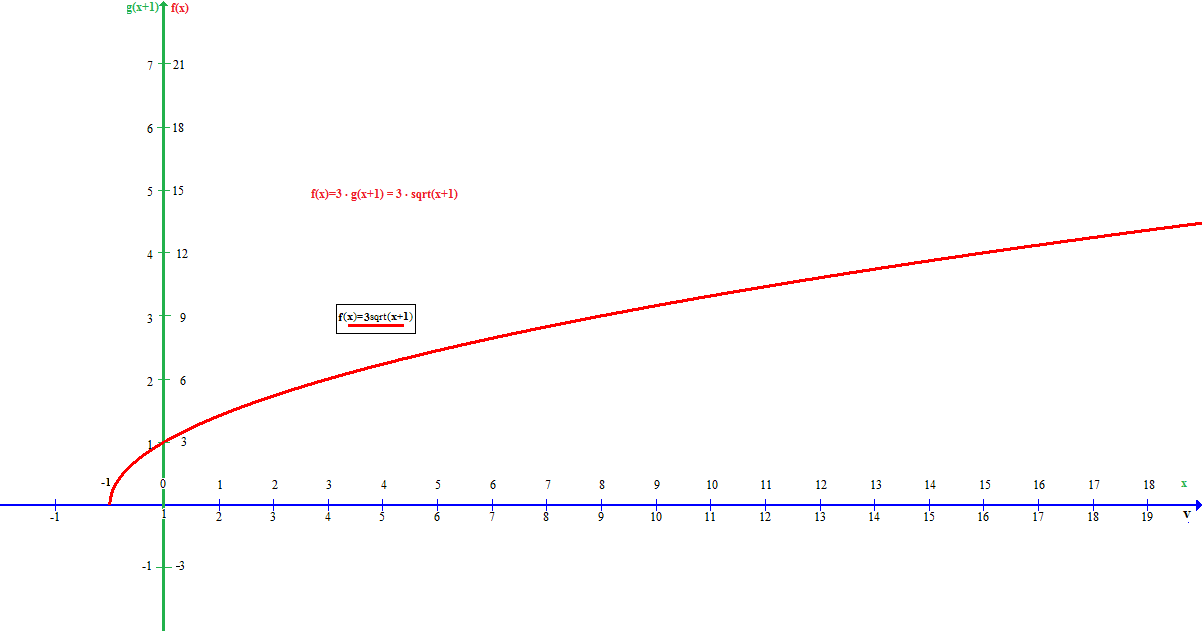
Now if we modify the vertical axis, replacing #g(x+1)# with #f(x)# by changing the scale so that each value on the vertical axis is replaced by #3# times its original value (i.e. #f(x)=3xxg(x+1)=3sqrt(x=1)#)
#color(white)("XXX"){:(ul(x),color(white)("xx"),ul(v),color(white)("xx"),ul(g(v)),color(white)("xx"),ul(g(x+1)),color(white)("xx"),ul(f(x)=3g(x))),(-1,,0,,0,,0,,0),(0,,1,,1,,1,,3),(1,,2,,4,,4,,12),(2,,3,,9,,9,,27),(3,,4,,16,,16,,48):}#
and our final graph looks like: