Given the following graph for a reactant concentration as a function of time, estimate the instantaneous rate of reaction at #"40 s"#?
1 Answer

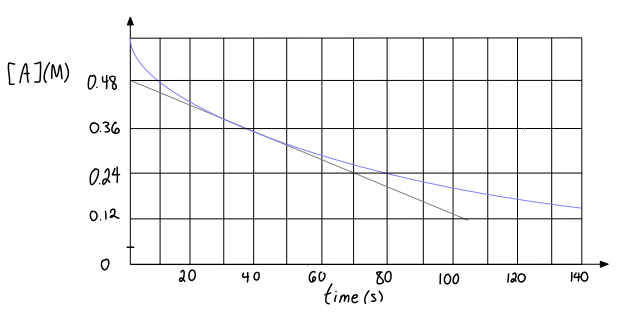
The instantaneous rate of reaction at a specific time is given by the line tangent to the curve that describes the slope at that specific time.
You are already given the tangent line, so what you can do is choose the easiest points to consider when calculating the slope at
You will have to stare at the graph and estimate
However, given that a forward reaction has a positive rate, take care to enter the magnitude, instead of the value itself.
#color(blue)(|(Delta[A])/(Deltat)|) = |("0.48 M" - "0.24 M")/("0 s" - "70 s")|#
#= color(blue)(color(red)(bb(+))3.4_(29) xx 10^(-3))# #color(blue)("M/s")# where subscripts indicate digits past the last significant figure.
Note that if this is not correct, it is either a matter of estimation error (which is why I suggested to choose the points right at the grid intersections!) or the sign.
