Are bar graphs and histograms the same?
1 Answer

Bar graphs and histograms are not the same.
Explanation:
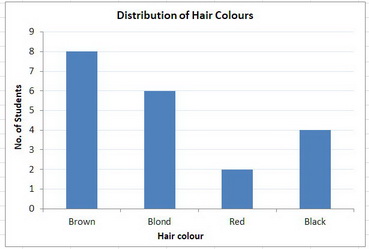
We use bar graphs to display "categorical data", that is, to compare different categories of data.
For example, suppose that you noted how many students in your class had a particular hair colour.
You might present the information in a bar graph as:
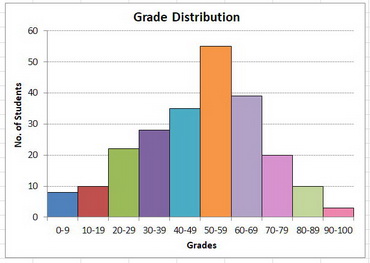
We use histograms to present "continuous data", that is, show the frequency of numerical data in a given category.
In continuous data, the numbers can have any value in a certain range. A good example is exam grades. They could have any value from 0 to 100.
For example, you might ask each student what grade they received on the recent exam. You would divide the data into intervals and present a histogram:
Another difference between bar graphs and histograms is that the bars in bar graphs are usually separated. In histograms, the bars never have spaces between them, because the data are continuous.
A third difference is that the bars in bar charts can be in any order. We cannot reorder the bars in histograms.
