How can I represent enthalpy in a potential energy diagram?
1 Answer

In the context of a potential energy diagram, there is an enthalpy of bond formation at the equilibrium bond distance. It is not entirely obvious, but it is the potential energy shown on the y-axis.
The equilibrium bond distance is known as the most stable proximity in space for each atom to be before a chemical bond can be made.
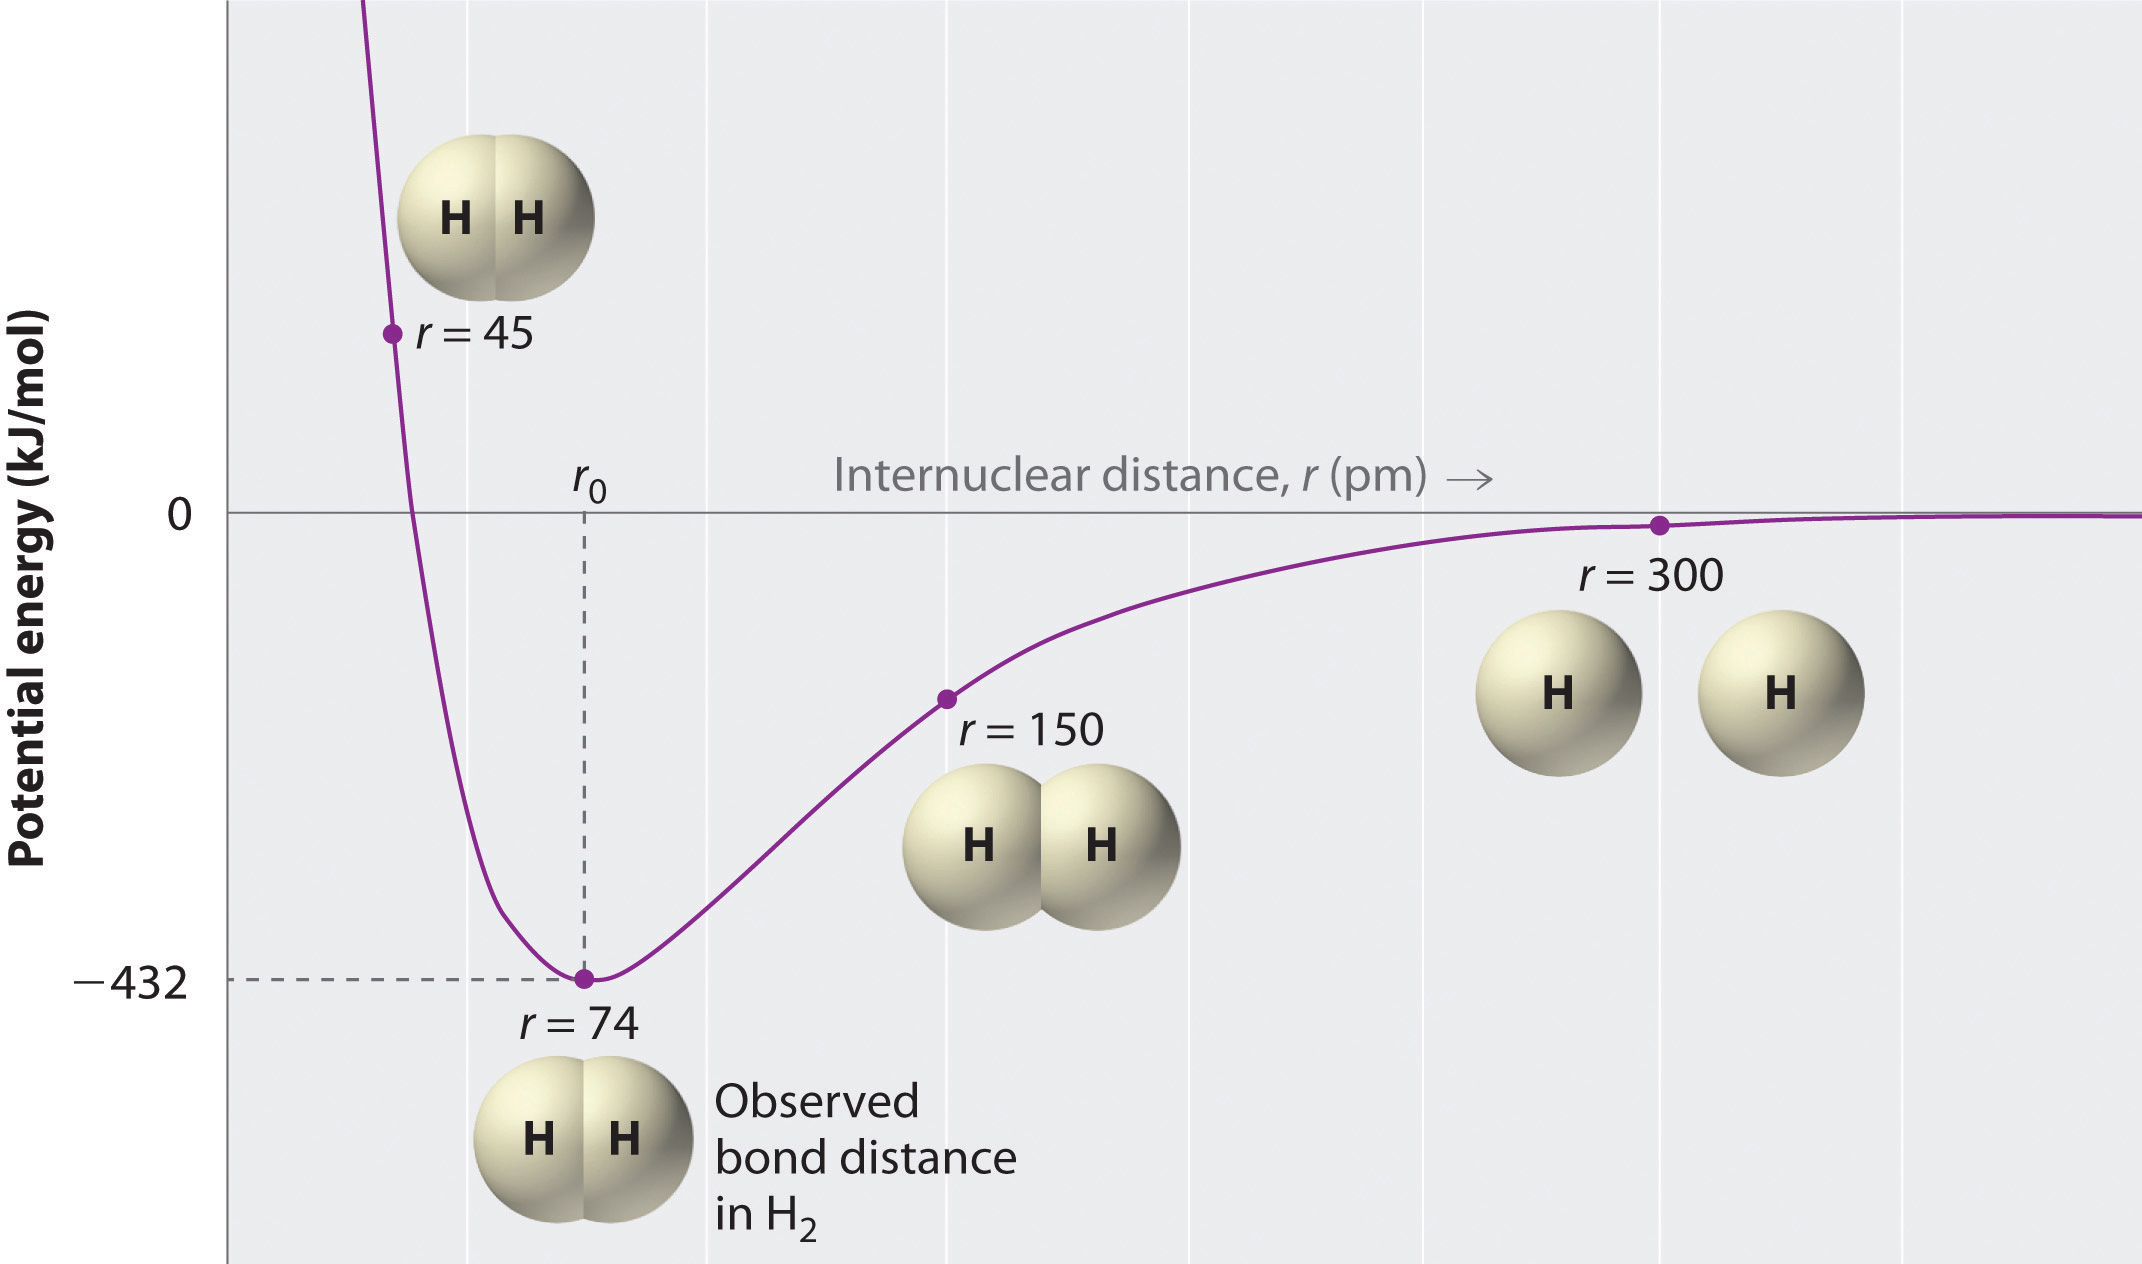
Side note: with only two atoms bonding, it doesn't matter at all where they are in the second or third dimensions---they will always be aligned in one dimension. So, the bond distance is in the "radial" direction, called r.
You can see that the optimal bond distance is
The enthalpy of the formation of the
This enthalpy is the difference in energy between the nonbonded state and the bonded state, and in the diagram, is therefore in reference to the zero-point energy. In this case, the zero-point energy represents no bonding interactions.
(You can define the zero-point energy anywhere, technically, but typically we just put that on the x-axis for simplicity.)
