How do I graph a quadratic equation in Excel?
1 Answer

I would start by choosing the first column of the spreadsheet for the values of
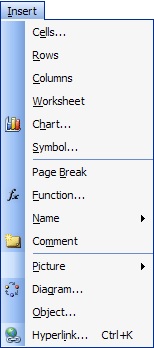
Next I would select the two columns (highlighting them) and choose "chart" from the menu "insert".
To get:
You can also use the icon:

to select the graphing option.
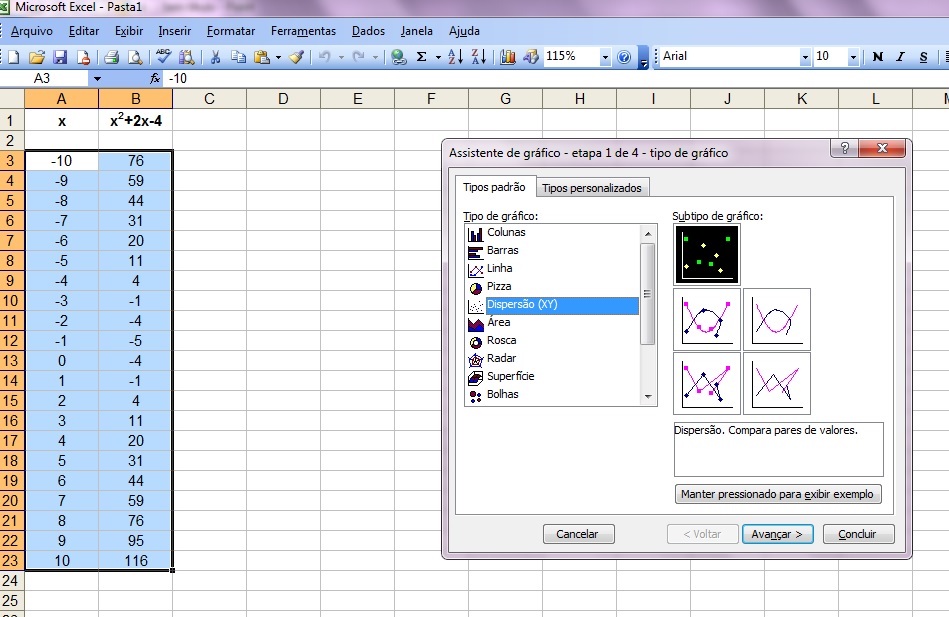
The right graph to use is the "xy scatter". This is represented by the following icon (in the chart window):

You can now choose to plot only the points or lines and points.
I've chosen points and smoothed lines from the boxes on the right of the chart window:

In the above Picture you can see the graph and the two columns for
Note:
My version of Excel is in Portuguese but in English doesn’t change a lot.
If you want to plot a quadratic with Excel you have to choose your
Hope it helps
