color(green)("Consider each part of the standard equation "y=ax^2+bx+c" and what effect they have.")
color(blue)("Type 1" -> y=x^2
The coefficient of x is (+1). Because this is positive the graph is of general shape uu and symmetric about the y-axis. The minimum is at (x,y)->(0,0)
'~~~~~~~~~~~~~~~~~~~~~~~~~~~~~~~~
color(blue)("Type 2" -> y=-x^2
The coefficient of x is (-1). This is negative so the graph is of general shape nn and symmetric about the y-axis. The maximum is at (x,y)->(0,0)
'~~~~~~~~~~~~~~~~~~~~~~~~~~~~~~~
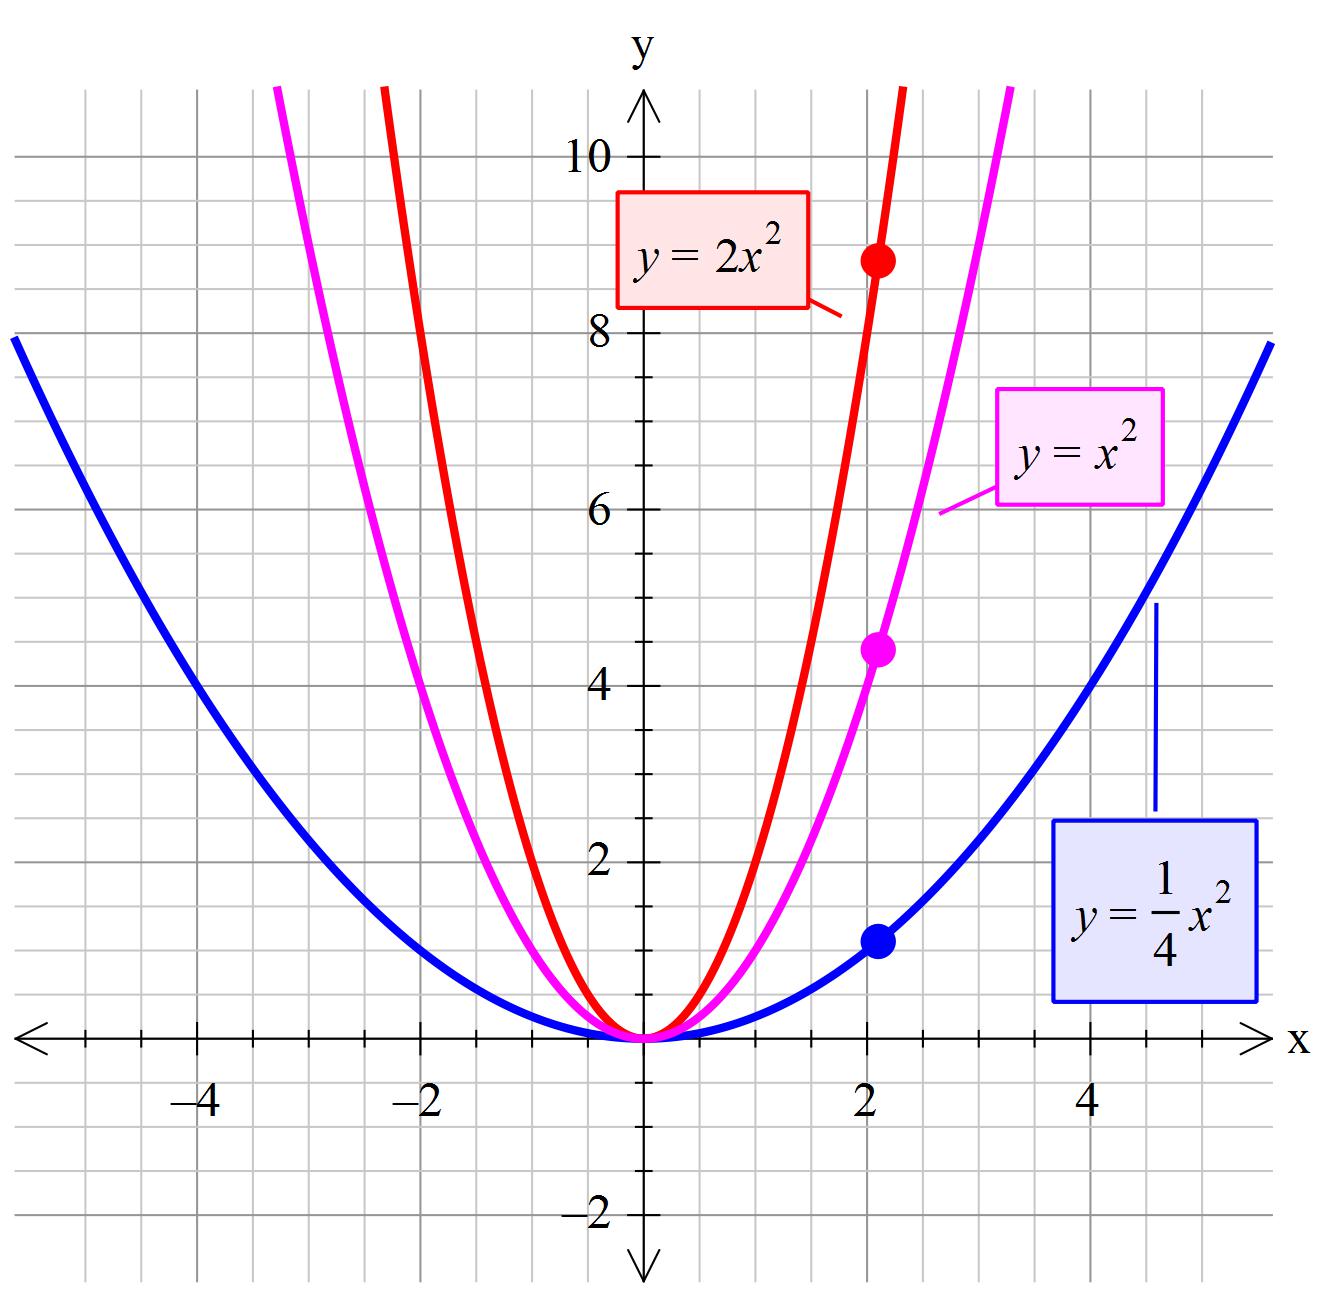
color(blue)("Type 3" -> y=ax^2
If" "-1 < a < +1 " "then the graph is wider (Shallower gradient )
if" "-1 > a > +1" "then the graph narrows (Steeper gradient )
'~~~~~~~~~~~~~~~~~~~~~~~~~~~~
color(blue)("Type 4" -> y=x^2+c
If the value of c is positive it 'lifts' each point of the graph upwards by the value of c. Conversely if c is negative it lowers the graph.
'~~~~~~~~~~~~~~~~~~~~~~~~~~~~~~
color(blue)("Type 5" -> y=x^2+bx+c
The coefficient of b moves the plot sideways.
First write the equation as" "y=a(x^2+b/ax)+c
Now apply: " "(-1/2)xxb/a -> x_("vertex")
'~~~~~~~~~~~~~~~~~~~~~~~~~~~~~~~~~~~~~~~
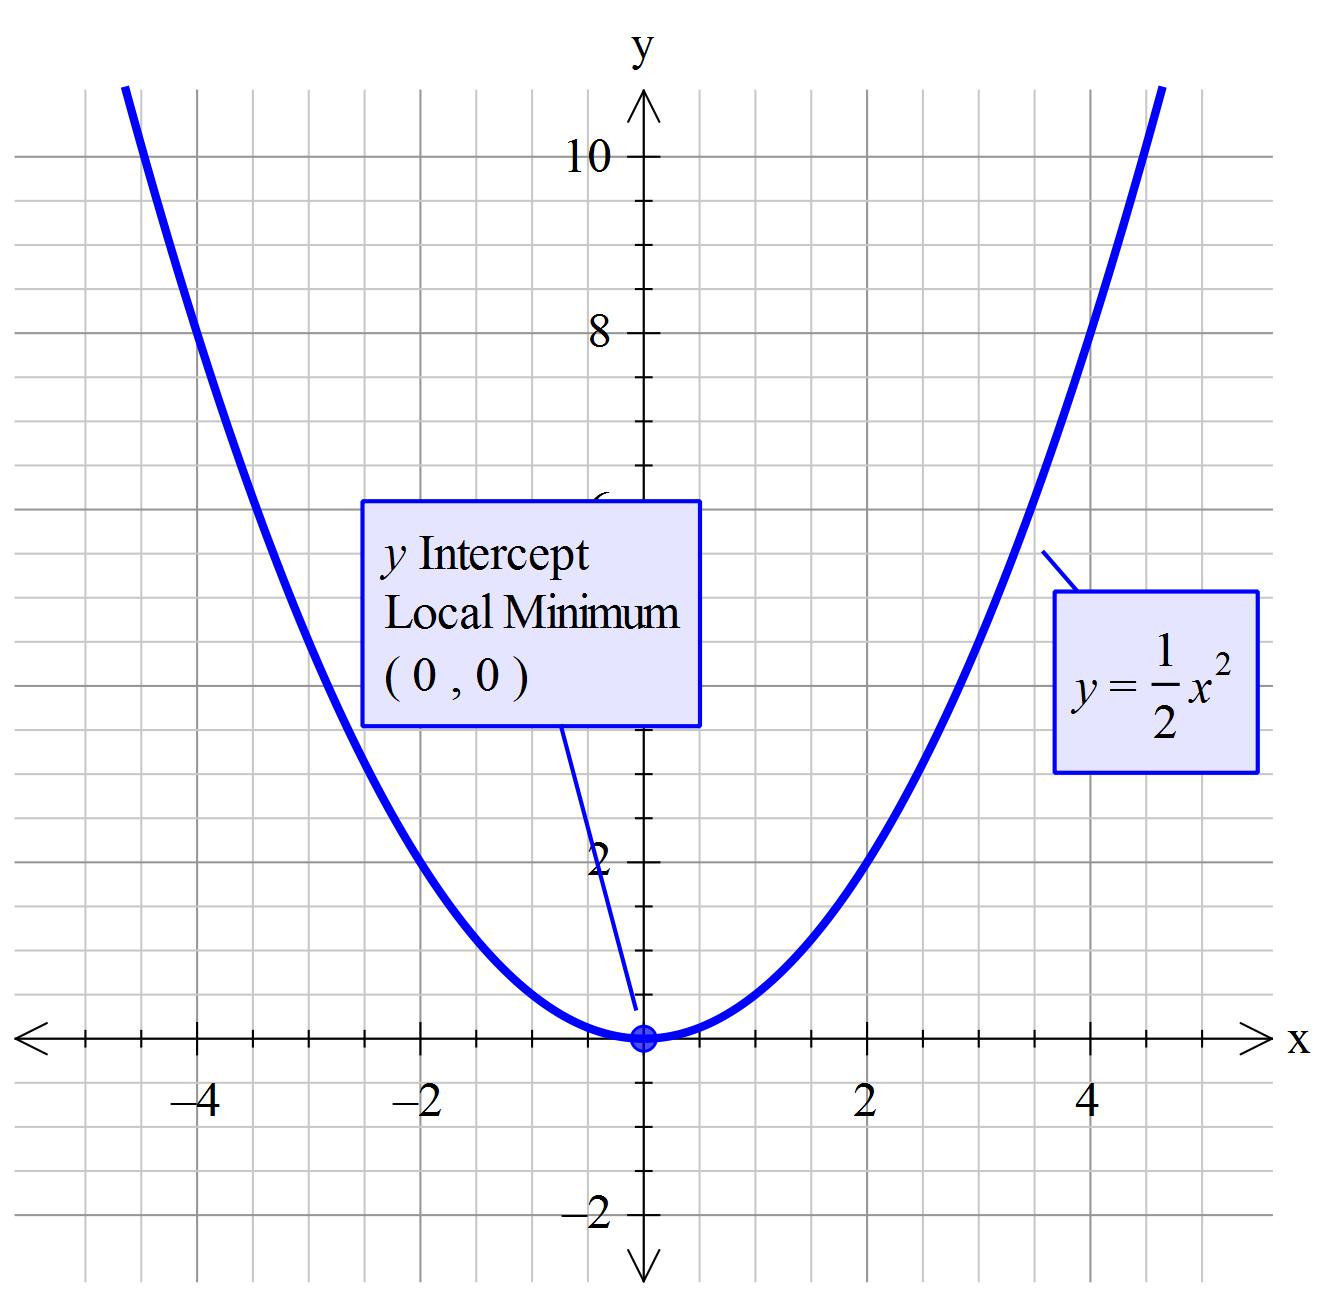
color(blue)("Answering your question")
Given:"" "y=1/2x^2
The coefficient of x^2 is positive so of general shape uu thus the graph has acolor(blue)(" minimum.")
There is underline("no") constant value c underline("nor") is there any bx
So it is a mixture of Type 1 and Type 3. Consequently
color(blue)("Vertex"->(x,y)->(0,0)
color(blue)("Axis of symmetry"-> x=0)
color(blue)("It is a minimum")
 Tony B
'~~~~~~~~~~~~~~~~~~~~~~~~~~~~~~~~~~~~~~~~~~
color(green)("This graph shows what happens when you change the coefficient of "x^2" ( changing the value of "a" in "y=ax^2"))
 TonyB
TonyB

