How do you graph #-40 \le y < 60# on a number line?
1 Answer

May 16, 2018
see below :)
Explanation:
ok
so you have your number line
its a nice lil line
for the ones with a less/greater than or equal to (< or > with the line under it) you put a solid dot on the value
so like in yours you'd put a filled in dot on -40
and for the ones that are just < or > (without underline) you put a dot THAT IS NOT FILLED IN (important).
so in yours itd be an unfilled dot on 60
and now we look a little more closely at the sign
what this problem essentially says is y is greater than or equal to -40, but smaller than 60
so you draw a nice dark line spanning from -40 to 60
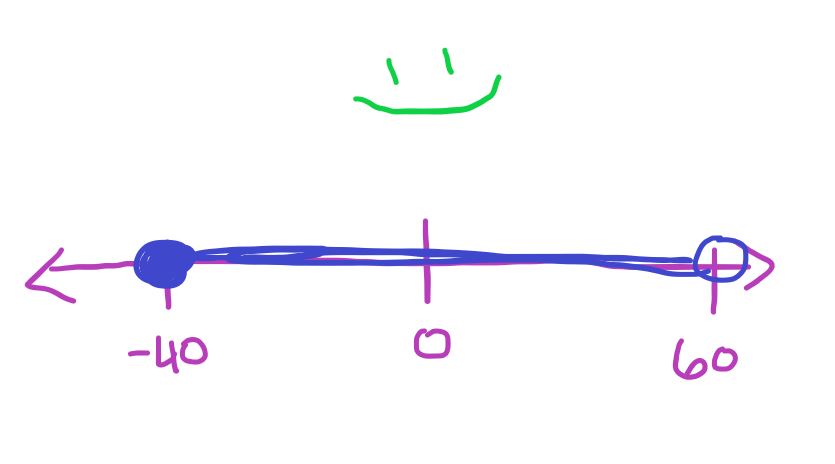
ta da
