How do you graph and label the vertex and axis of symmetry y=2x^2+4x+1?
1 Answer
Explanation:
The aim is to find some points, and from that fill in the rest of the graph for your sketch.
Let
let
This does not factorise, since the discriminant
So
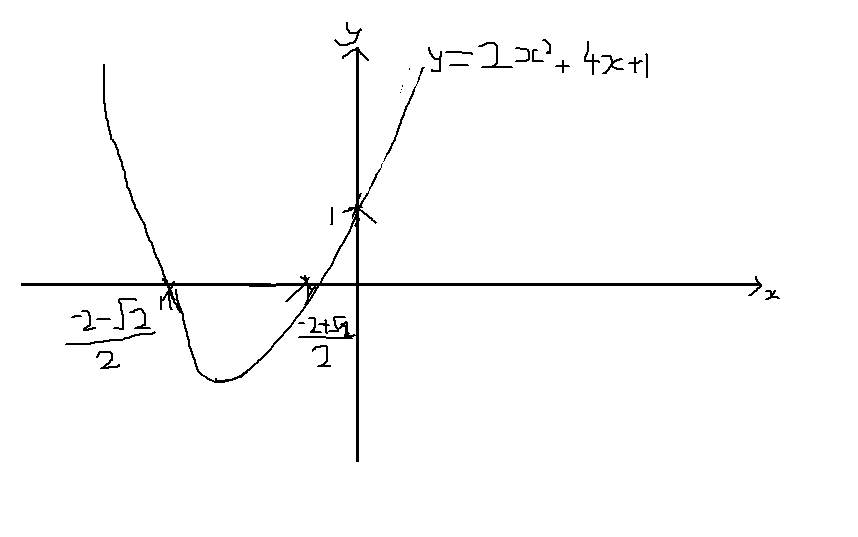
Both of these answers are negative (-2+sqrt2/2 comes out to something like -0.3) so we plot these along on the negative side of the graph. If we are sketching, it doesn't have to be accurate; as long as you put them both in the same quadrant with the space between the roots and the y-axis being relatively to scale.
Mark your points on the graph and connect them. Remember we have a minimum point halfway between the roots.
graph{2x^2+4x+1 [-6.783, 4.317, -1.77, 3.777]}
On your x-axis, mark on where the roots are. eg at the point that x crosses the axis, write
Ok, this graph I've drawn is really bad; it was done on a computer screen with a touchpad after all but it shows you the main features of a sketch. It labels the graph's equation, the x- and y-axes; it adds arrows to the ends of the x and y-axes to show they continue; it marks on the roots and y-intercept. Try to focus on the shape of the graph as you draw it, particularly around the roots and then ends of the graph.
