How do you graph #f(x) = -2 * 3sqrtx#?
1 Answer
May 14, 2018
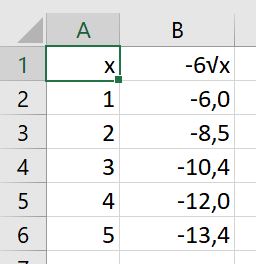
Use Excel to calculate a number of points,
Explanation:
First we note that x must be positive for us to be able to graph it.
We have
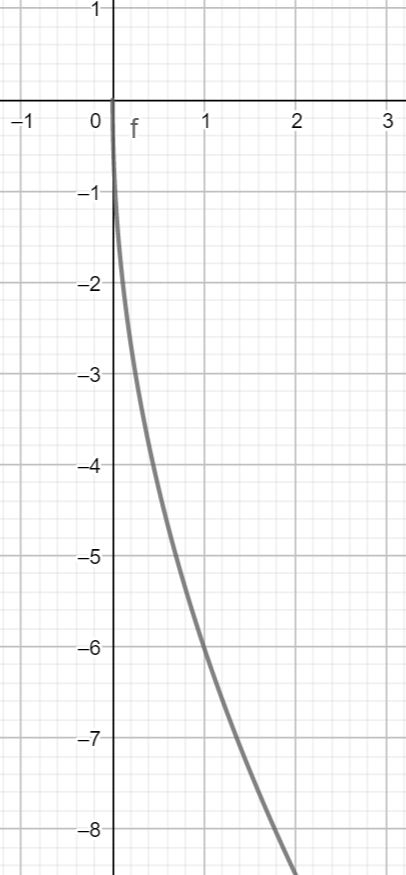
Using for instance Geogebra we get:
If we have to plot it manually on a graph paper, we first need to calculate some points which the graph should go through. The easiest would be to use Excel, where we have the x values in one column and let Excel calculate
Then we plot the values in our praph paper and draw a nice line through the points that we have ploted.
