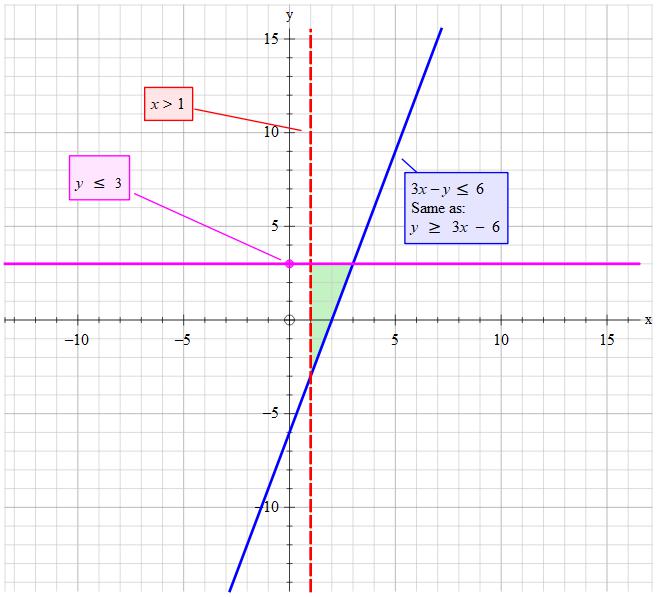
How do you graph the inequality #3x-y<=6 #, #x>1# and #y<=3#?
1 Answer

Feb 20, 2018
See the explanation
Explanation:
The area of feasible solutions is that which satisfies all these criteria.
A solid line indicates that you use the points on the line.
A dotted line means you can not use the points on the line