How do you graph the inequality 6x+5y<-30?
1 Answer

May 6, 2016
See explanantion
Explanation:
Subtract
Divide both sides by 5
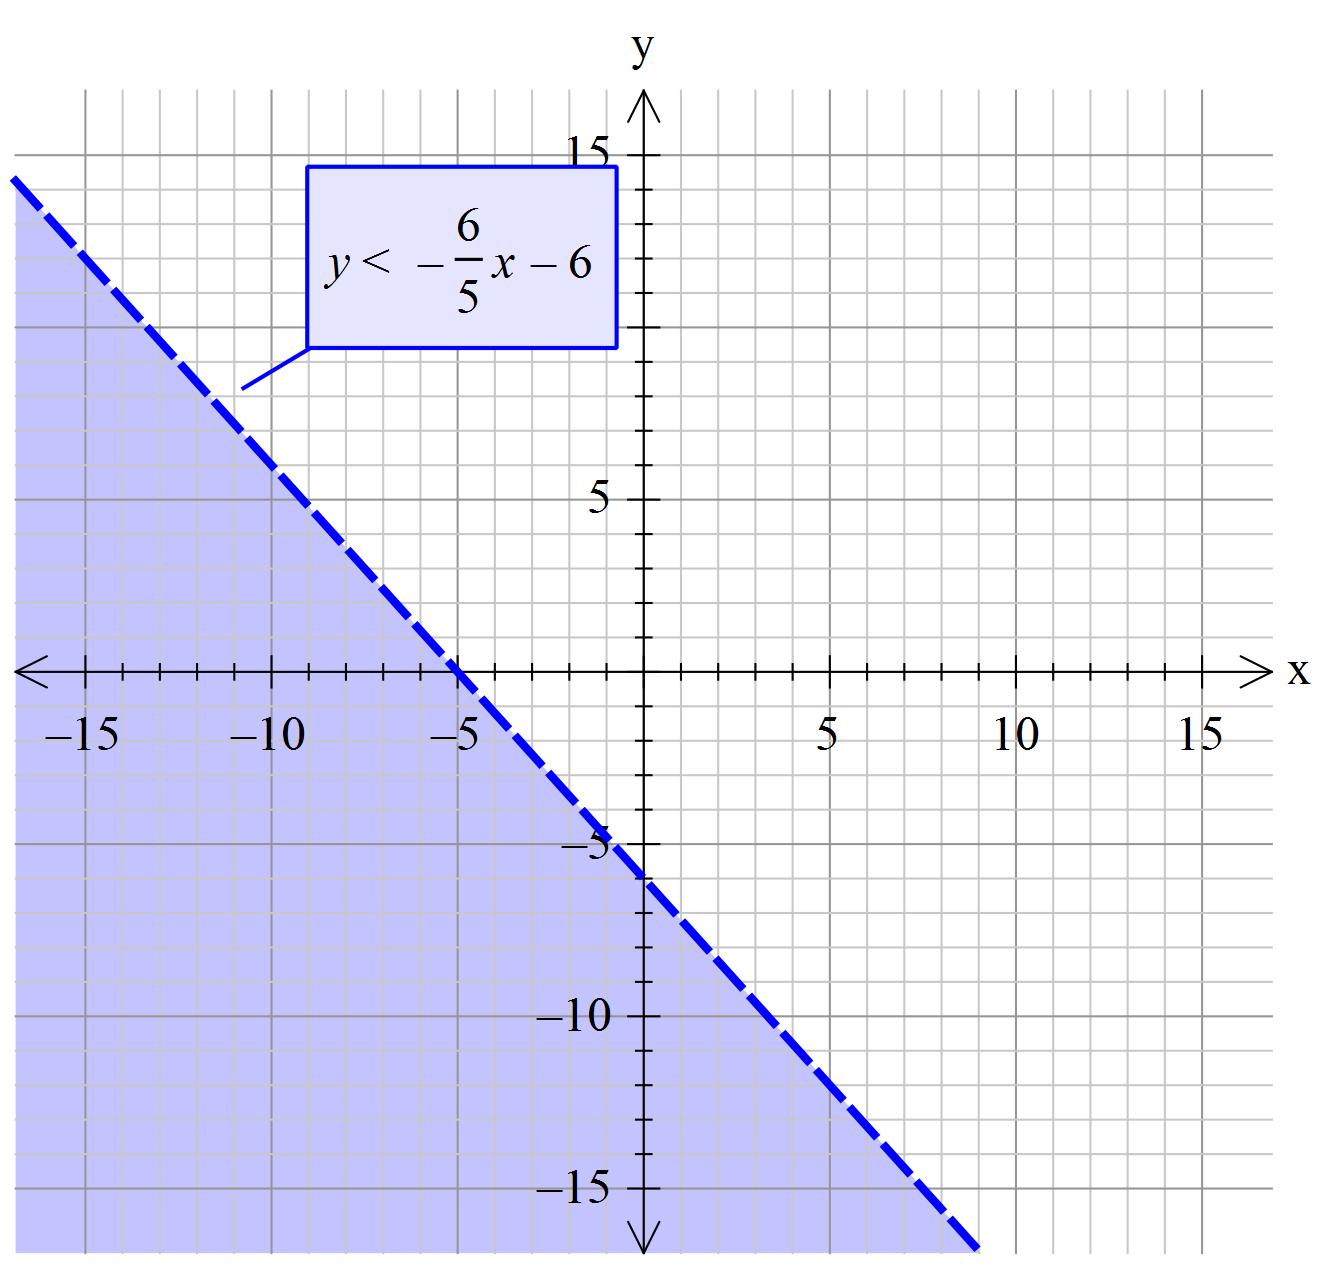
Now plot as though it is a straight line graph
Notice that the line is dotted. If the inequality had been
 Tony B
