How do you graph the inequality #x^2 + 7x + 6 <=6#?
2 Answers
Mar 22, 2016
Graph quadratic function.
Explanation:
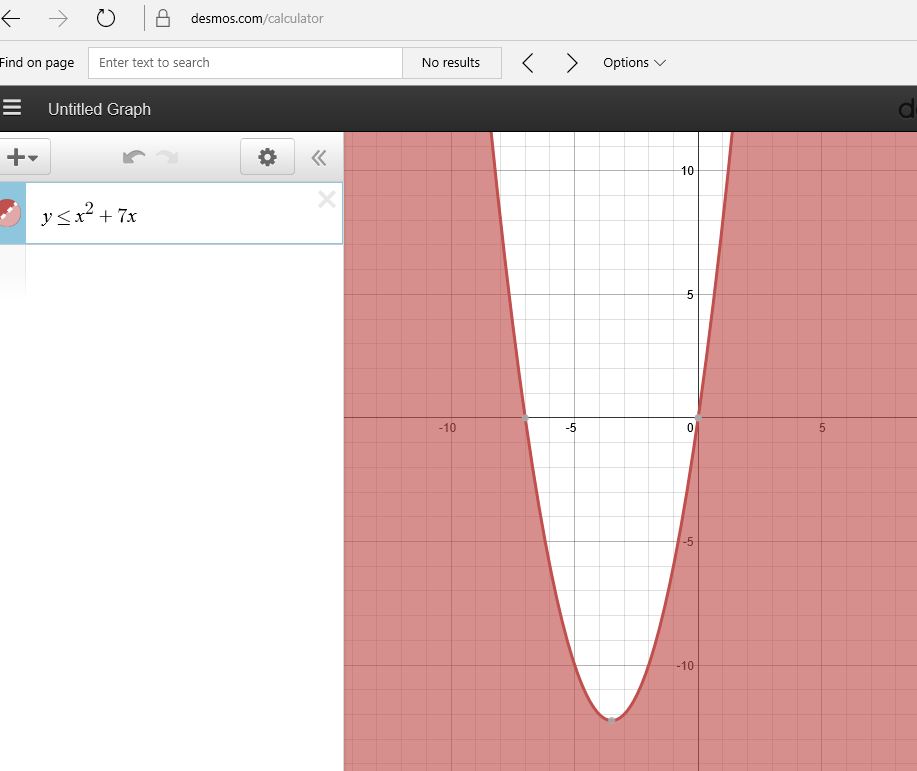
First, graph the parabola y = x(x + 7) = 0 by the vertex and the 2 x-intercepts.
x-coordinate of vertex:
y-coordinate of vertex:
The 2 x-intercepts are --> y = 0 --> x = 0 and x = -7.
The solution set of the inequality (1) is the area below the parabola.
graph{x(x + 7) [-40, 40, -20, 20]}
Note. The parabola is included in the solution set.
Mar 22, 2016