How do you graph the inequality #y>=-1#, #x>=3#?
1 Answer

Jan 29, 2018
See a solution process below:
Explanation:
First, we can graph the inequality
- A solid line at
#-1# on the vertical access, The line is solid because the inequality operator contains an "or equal to" clause. - Shade above the line because the inequality operation contains a "greater than" clause
graph{ y >= -1[-10, 10, -5, 5]}
First, we can graph the inequality
- A solid line at
#3# on the horizontal access, The line is solid because the inequality operator contains an "or equal to" clause. - Shade to the right of the line because the inequality operation contains a "greater than" clause
graph{ x >= 3[-10, 10, -5, 5]}
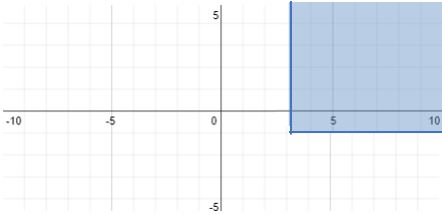
Now, we can show where the two graphs intercept: