How do you graph the inequality #y>=3/2x-3#?

1 Answer
Jul 24, 2018

#" "#
Please read the explanation.

Explanation:

#" "#
We have the inequality:

#color(red)(y>=(3/2)x-3#

If we can find both the x-intercept and the y-intercept, we can graph.

#color(green)(Step.1#

To find the x-intercept, set #color(blue)(y=0#

Replace #color(red)(>=# sign to #color(red)(=# for this step.

#y=(3/2)x-3#

#0=(3/2)x-3#

Add #color(red)(3# to both sides of the equality

#rArr 0+3=(3/2)x-3+3#

#rArr 3=(3/2)x-cancel 3+cancel 3#

#rArr 3=(3/2)x#

Divide both sides by #color(red)(3/2#

#rArr x = 3*(2/3)#

#rArr x = cancel 3*(2/cancel 3)#

#color(blue)( :. x= 2#

Hence, x-intercept: #color(blue)((2,0)# ... Res.1

#color(green)(Step.2#

To find the y-intercept, set #color(blue)(x=0#

Replace #color(red)(>=# sign to #color(red)(=# for this step.

#y=(3/2)x-3#

#y=(3/2)(0)-3#

#color(blue)( :. y= -3#

Hence, y-intercept: #color(blue)((0,-3)# ... Res.2

Use both the intermediate results, Res.1 and Res.2, and plot the points on a graph.

Join the two points #color(blue)(("x-intercept" and "y-intercept)"# with a Solid Line, as our inequality uses a #=# sign as well.

That would mean the value is a part of the solution.

#color(green)(Step.3#

Shading the Solution Region can be done as follows:

Use a Test Value to determine which part of the graph to shade.

Consider the point #color(red)((0,0)#

Substitute these values of #color(blue)(x and y# and test the inequality.

We have the inequality:

#color(red)(y>=(3/2)x-3#

#rArr 0>= (3/2)*(0)-3#

#0>=-3#

This result is #color(red)("TRUE"#

So, the solution region is above the line of the graph.

And hence, our inequality graph will be:

enter image source here

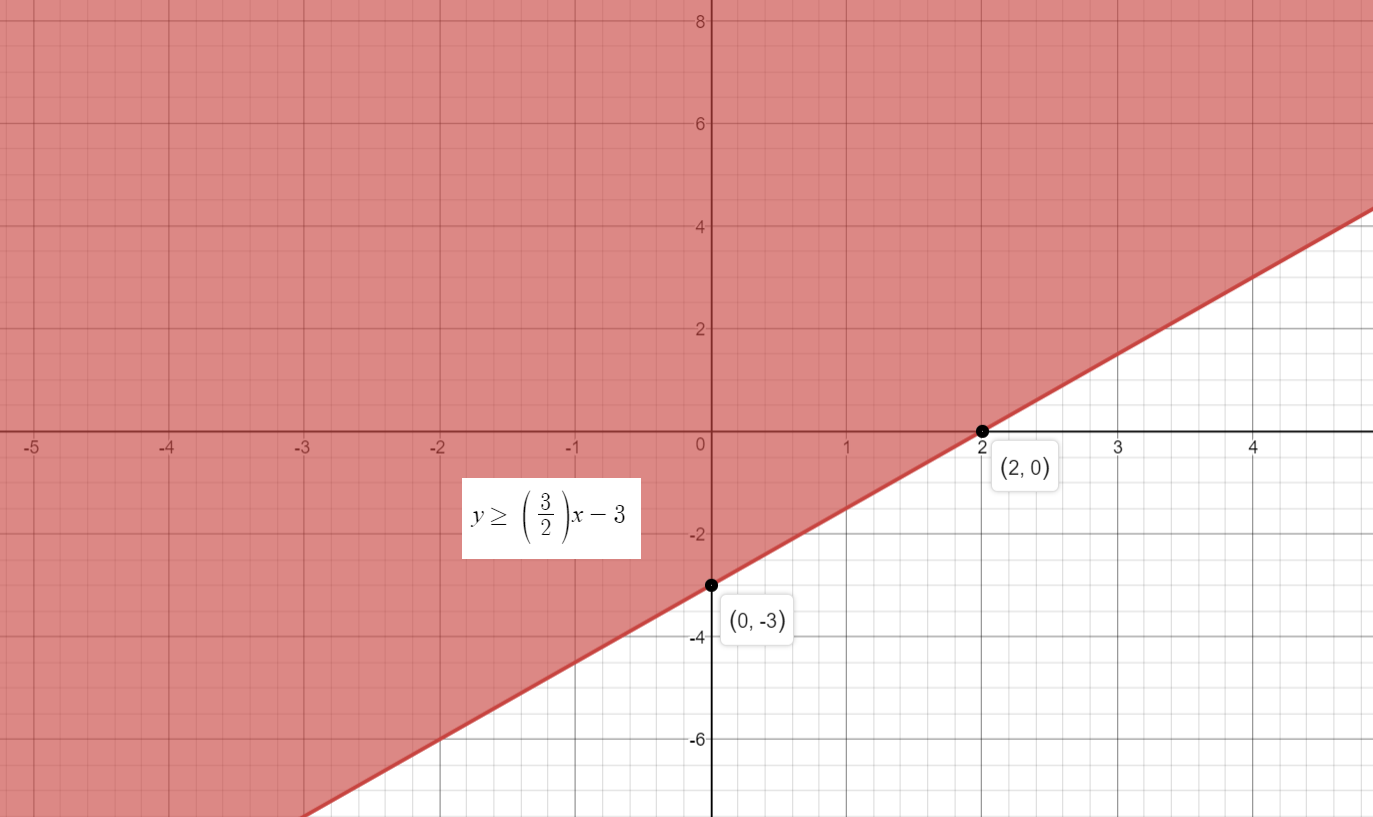
Solid line used indicates that the solution contains the values on the line.

Hope it helps.