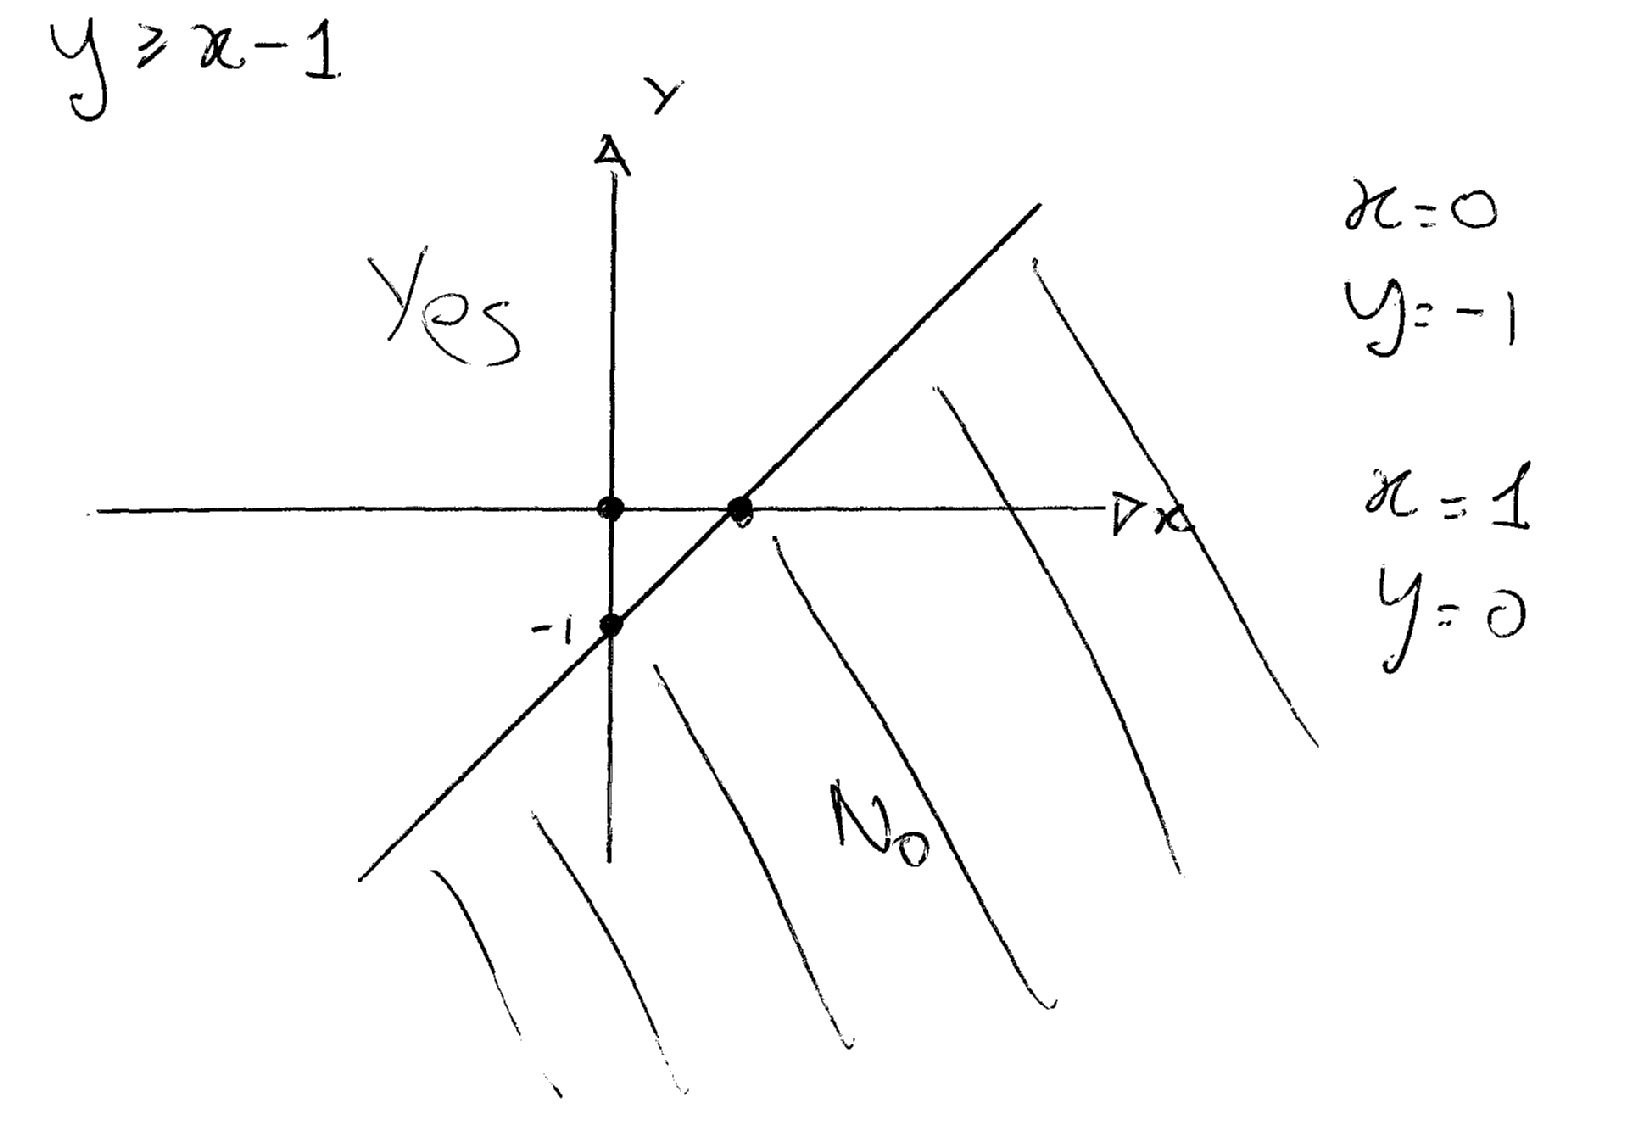
How do you graph the inequality #y>= x - 1#?
1 Answer
Apr 20, 2015
I would plot it as a normal linear function and then choose the region above the line (continuous to indicate

I would plot it as a normal linear function and then choose the region above the line (continuous to indicate


