How do you graph the inequality #y<=x-6#?
1 Answer
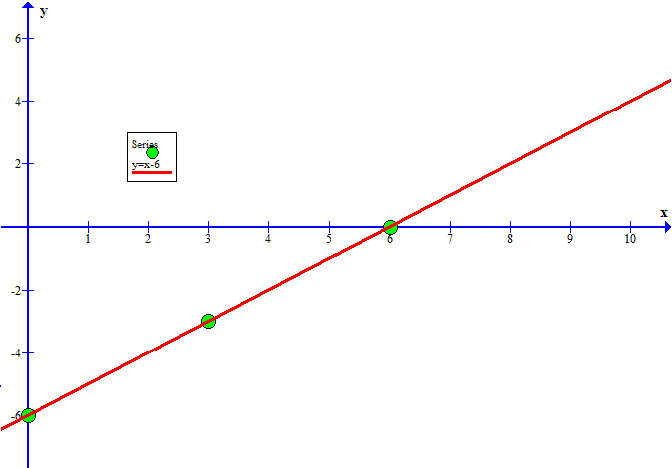
Graph the equation
Explanation:
For
Now graph these points and draw a straight line through them:
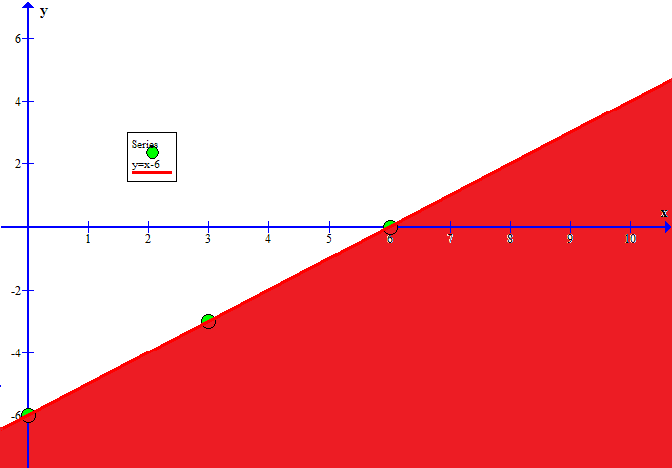
Next we need to shade (select) the side of this line for which
Consider an arbitrary point not on the line of equality.
For a case like this I often like to use
Is
That is, is
No.
Therefore, the side of the line of equality containing
Shade the other side (remembering to leave, the equality line solid since it represents valid solution points for