How do you graph the parabola #y= (x + 3)^2 - 2# using vertex, intercepts and additional points?
1 Answer

Jul 10, 2016
Refer explanation section
Explanation:
The given quadratic equation is in the vertex form
#y=(x-3)^2-2#
Hence the vertex is
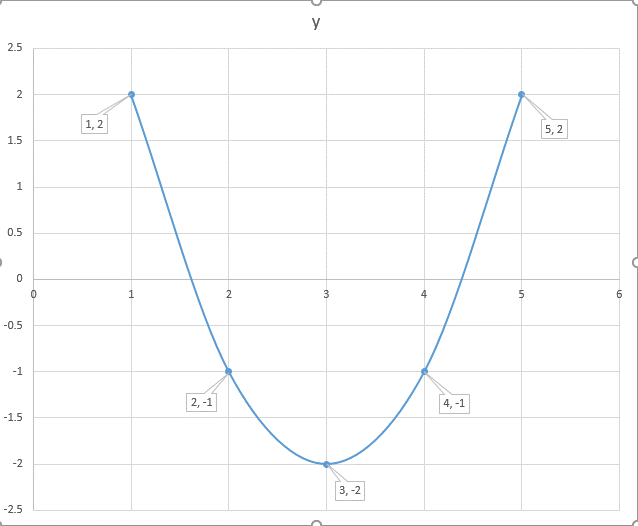
#x=-3# is the minimum point on the curve. Hence to graph the curve, we take two point to the left of#x=3# and two point to its right.
Right side points -
At
#(5,2)#
At
#(-4,-1)#
Left side points.
At
#(-2, -1)#
At
#(-1,2)#
Plot the points
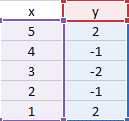
Table developed in Excel for the equation
You will get the graph.
Graph developed in Excel