How do you graph the system of linear inequalities x-y>=3 and y<15?
1 Answer

Feb 8, 2018
You have only asked "how do you graph"
Explanation:
 Tony B
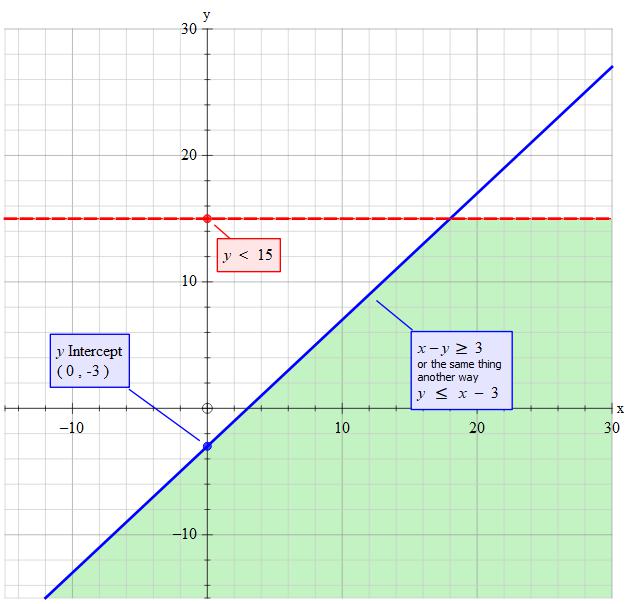
The feasible solution area has to satisfy the conditions of both inequalities at the same time. It is ALL THE VALUES IN THE SHADED AREA.
The lines are found by changing what is given to equations. The resulting line is 'the cut off'
If the inequality is a 'less than' or 'greater than' then the values on the line itself do not form part of the solution set (dotted line).
If the inequality is either of: 'less than or equal to', or 'greater than or equal to' then the values on the line itself may be includes (solid line).
