How do you graph the system of linear inequalities #y>=0# and #x<=9# and #x+y<15# and #y<x#?
1 Answer

Inequalities are represented by areas on a graph. The resulting area which is shaded by all of the inequalities is the set of values which satisfy all of the inequalities at the same time.
Explanation:
Inequalities are represented by areas on a graph. When we have multiple inequalities, we put multiple areas on the same graph. The resulting area which is shaded by all of the inequalities is the set of values which satisfy all of the inequalities at the same time.
Let's plot each of the inequalities in the question in succession beginning with
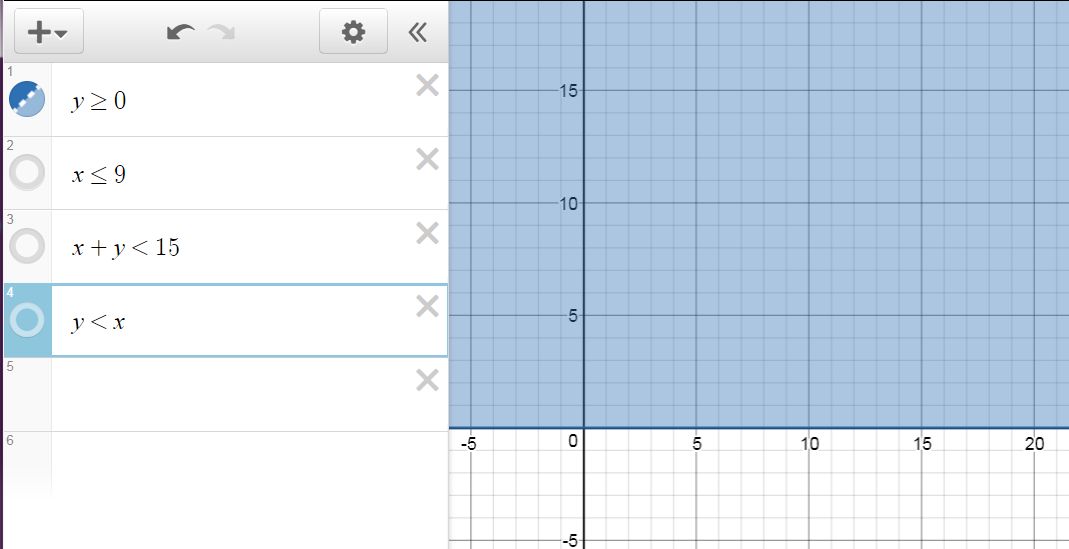
The inequality is everything above the
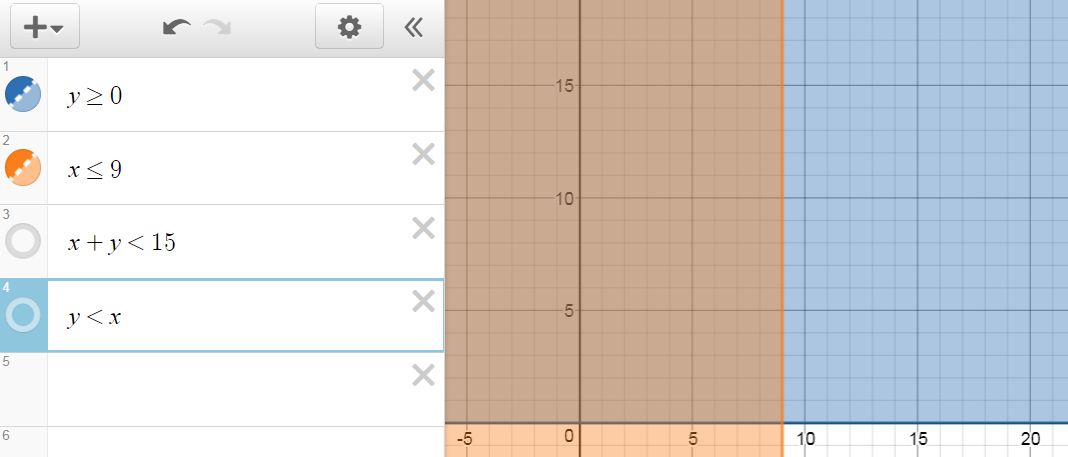
Now we have an area of overlap of these two inequalities. Adding the third inequality gives
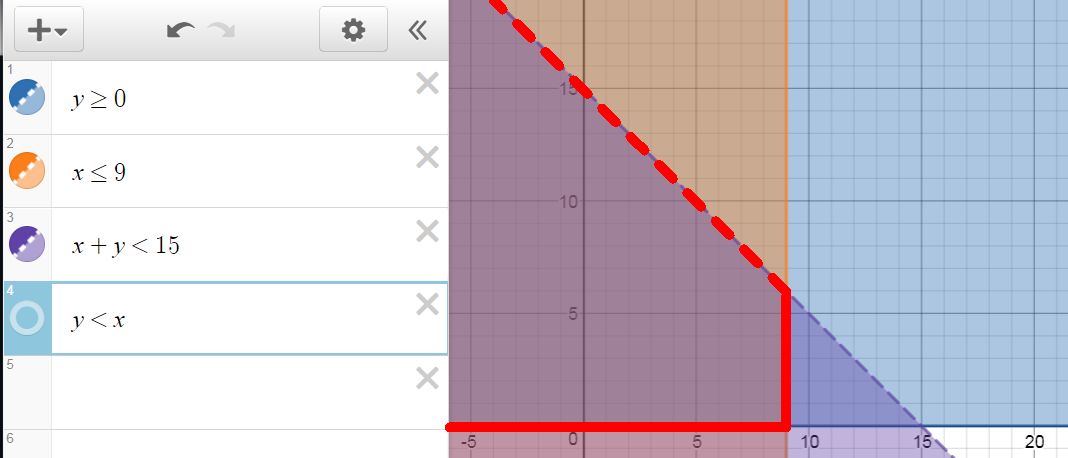
Since the overlap is getting a little complicated, I've outlined it in red. Note also that this inequality doesn't have an equals sign, so we represent that with a dashed line. Finally the last inequality gives us:
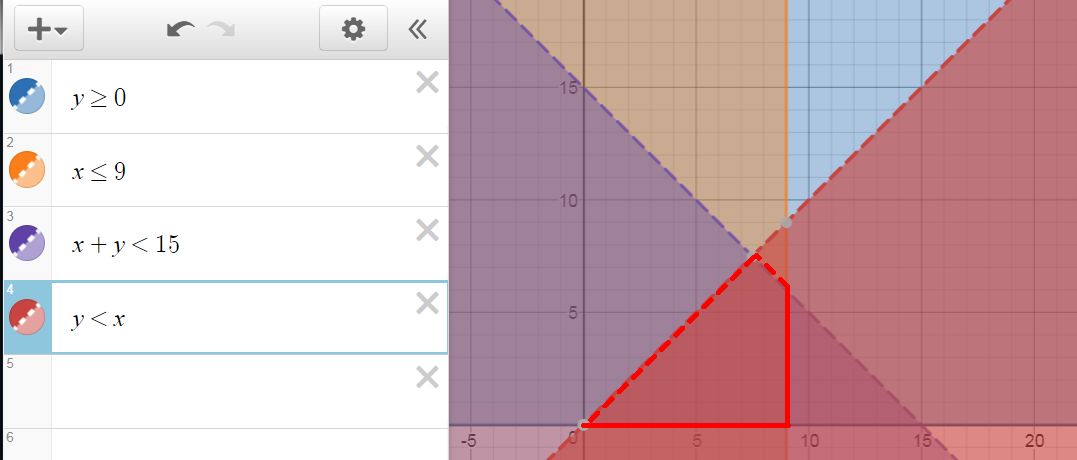
This gives us a confined overlap area with 4 sides. Two of the sides include the edge (solid lines) and two exclude the edge (dashed lines).
