How do you graph the system of linear inequalities #y>2x-7# and #4x+4y<-12#?
1 Answer

Aug 3, 2017
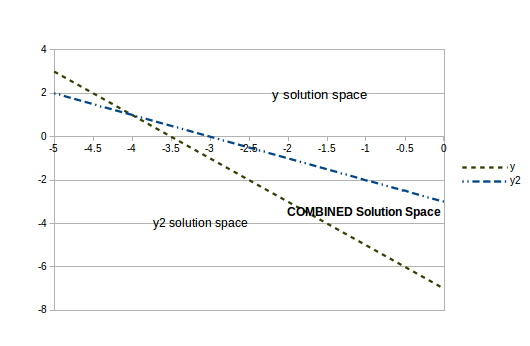
Plot the two lines. The solution is the set of points between them. The lines should be dotted (not included in the solution) and the space between the lines shaded.
Explanation:
Arrange the equations into standard format (y < ax + b). Calculate and plot some points. Check for the solution range for each inequality. Locate the common solution space for both inequalities.