How do you graph the system of linear inequalities #y> -3x# and #x<=5y#?
1 Answer

Please see the explanation.
Explanation:
Given:
Let
Let
Consider:
Switching sides, we get
We will divide both sides by 5:
Simplify:
We will consider:
for graphing.
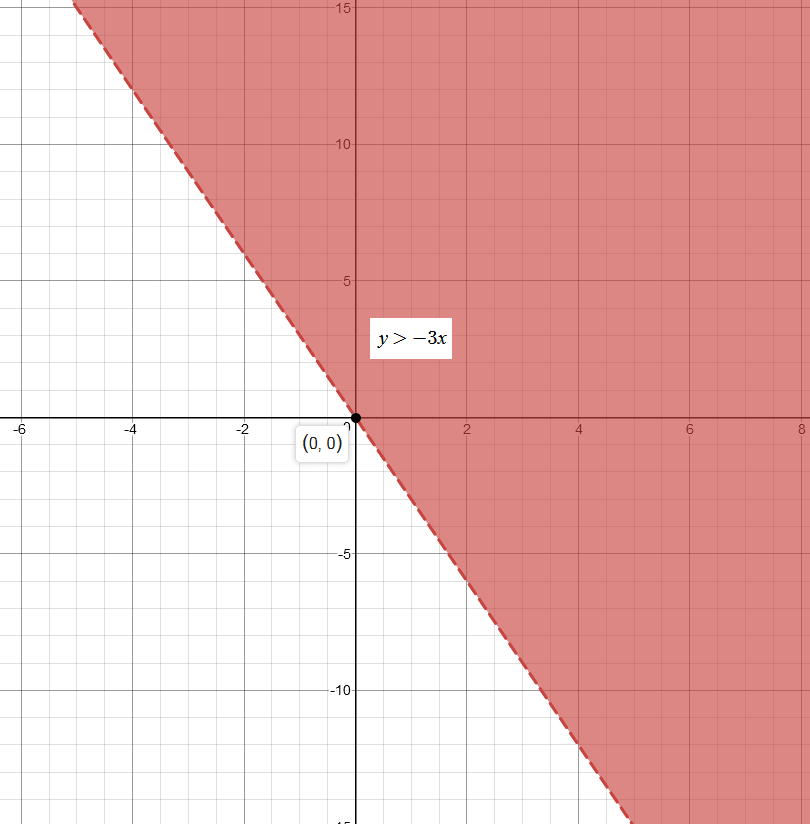
Please refer to the image of the graph of the inequality
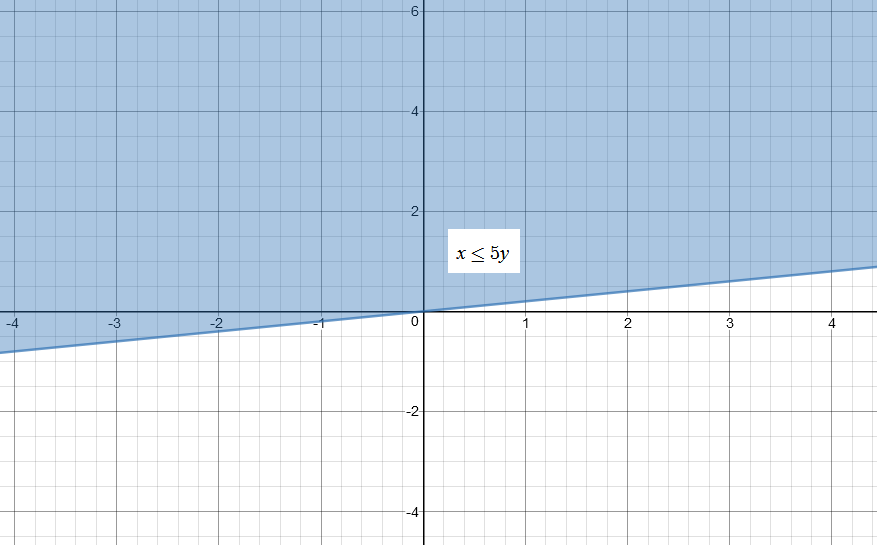
Please refer to the image of the graph of the inequality
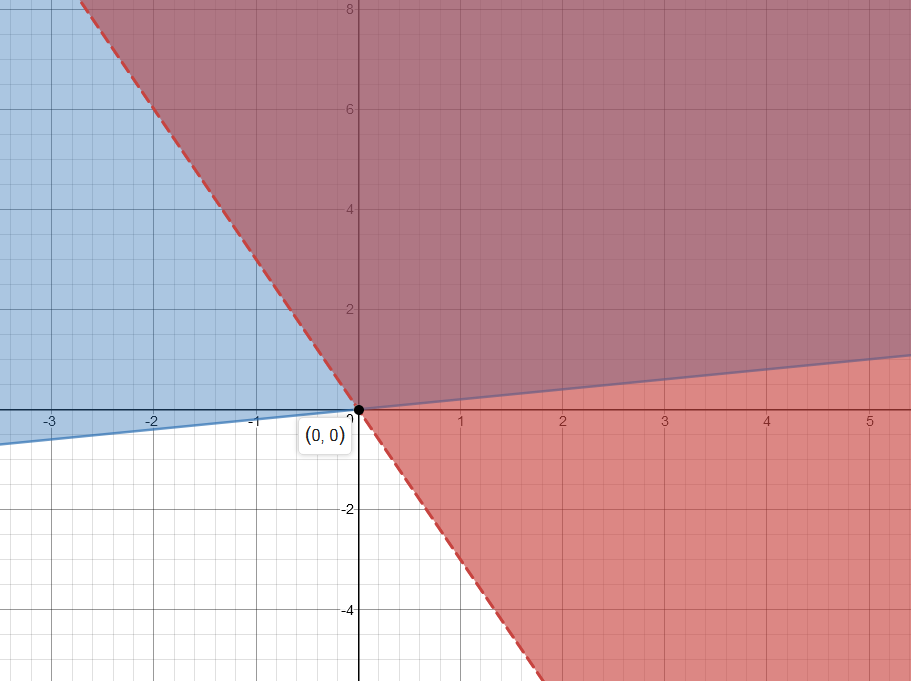
The Solution to the system of inequalities will be the area where the Shaded area from each inequality overlap one
another.
Please refer to the graph below to view the solutions:
Notice that we have a dashed line to show that it does not include values for
