How do you graph the system #x>5# and #y<=4#?
1 Answer

Aug 26, 2015
See the explanation.
Explanation:
graph{x > 5 [-4.585, 17.915, -4.465, 6.785]}
graph{y <=4 [-5.99, 19.32, -5.17, 7.49]}
The conjunction ("and") requires both to be true, so we need the part of the plane where these overlap. That is: we need the part that is shaded on both graphs:
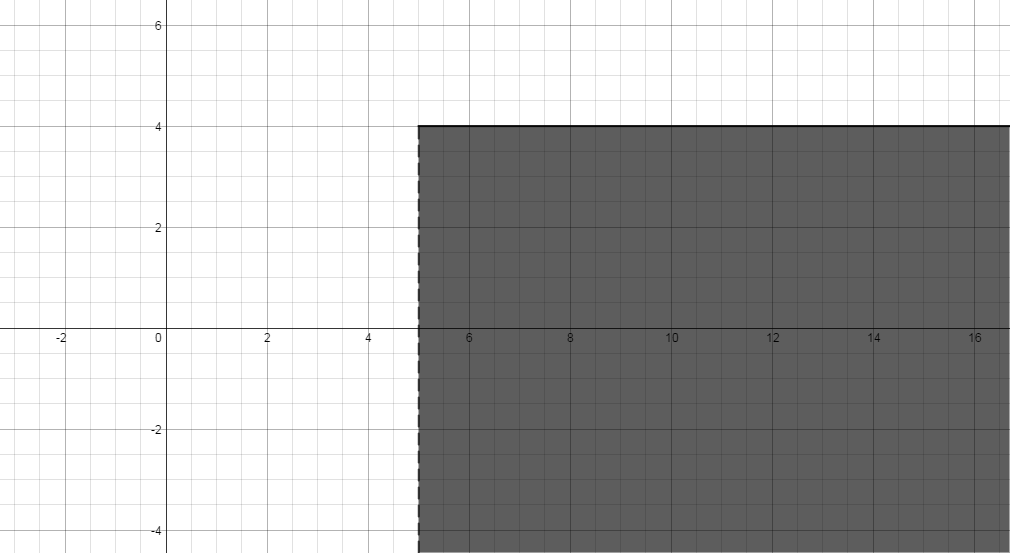
(I had to use a different graphing utility, so the colors are different and you cannot scroll this graph.)
