How do you graph the system #y<= 2x + 3# and #x > 1#?
1 Answer
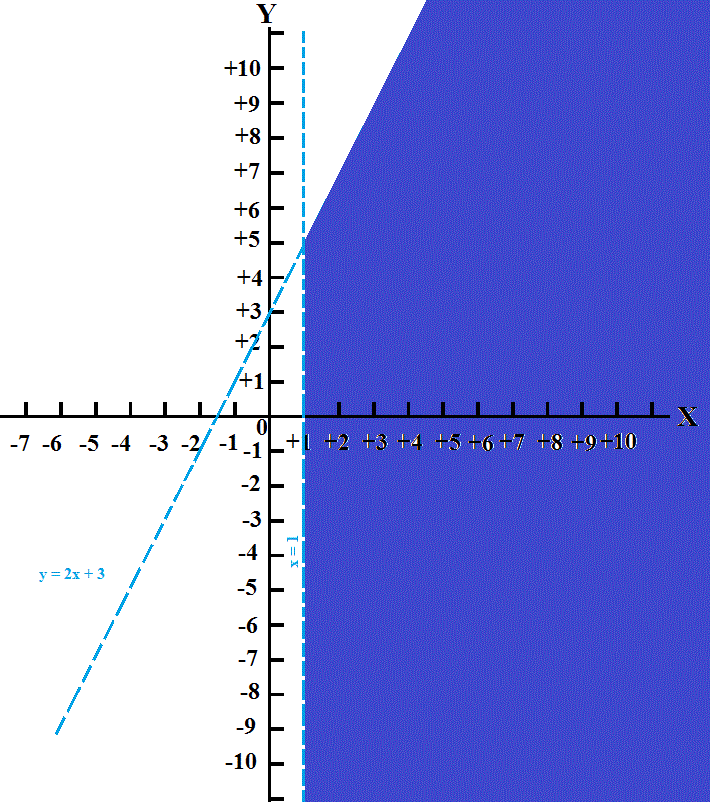
Draw the lines (initially dashed) for
Shade that section that included by inequalities.
Convert the dashed line along this section corresponding to
Explanation:
Step 1: draw dashed line for
Evaluate
for example
Draw the (dashed) line through the corresponding points on the Cartesian plane.
Step 2: draw dashed line for
Draw a vertical (dashed) line through
Step 3: Identify the section included in both inequalities
Test a few
For example
Step 4: Shade the section which includes the point that satisfies both inequalities
**Step 5: Convert the dashed line segment bordering the shaded area that corresponds to