How do you graph two complete cycles of #y=1/2sint#?
1 Answer

Please read the explanation.
Explanation:
Create a data table for the Parent function
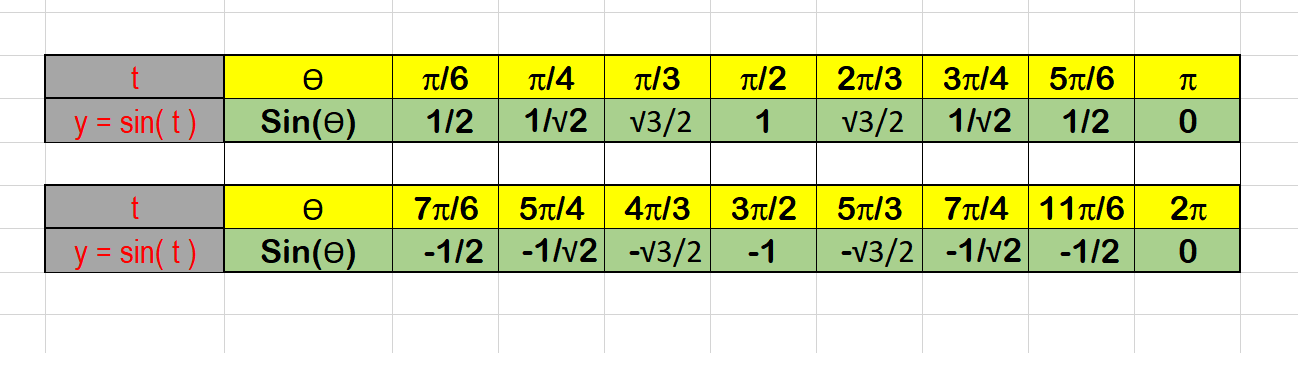
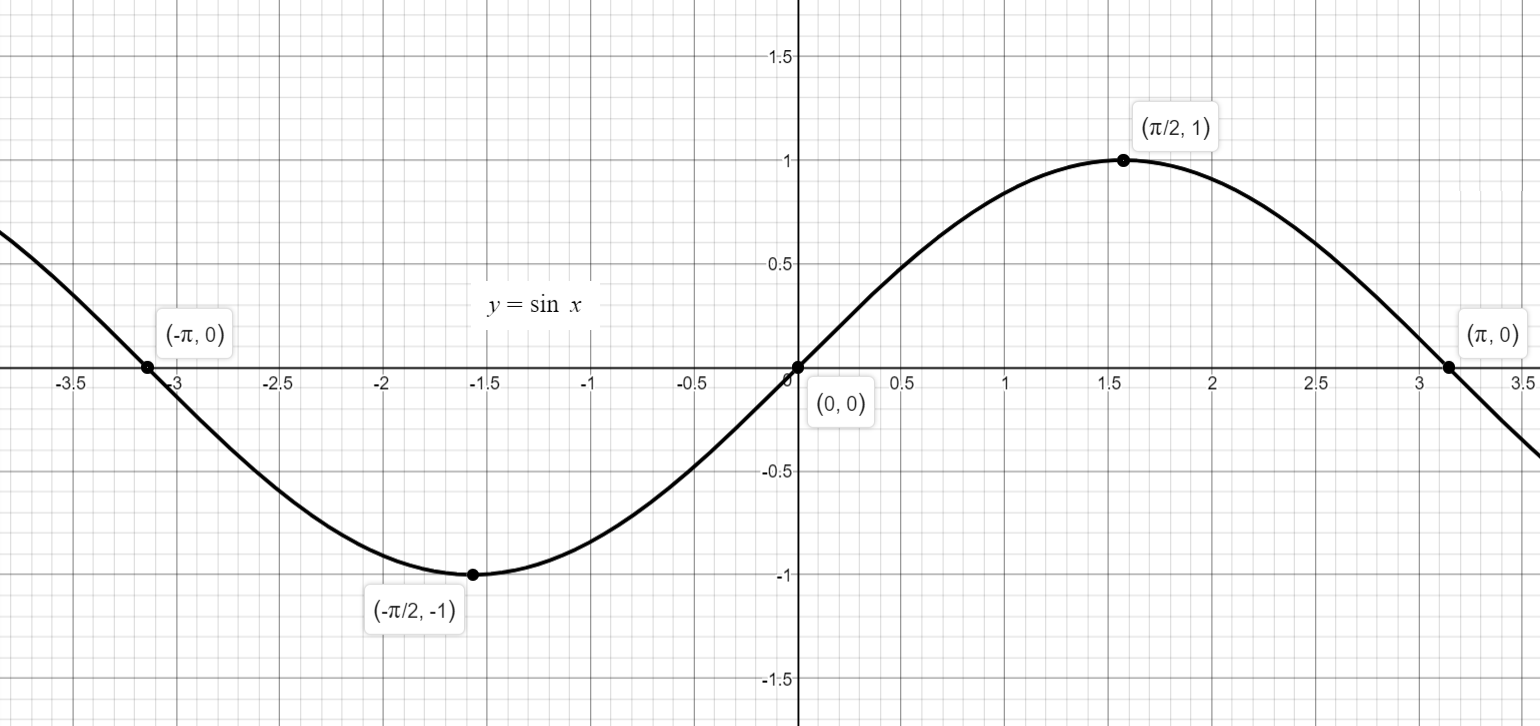
Graph the Parent function as shown below:
Next, graph the function:

Now, we understand the behavior of the graph
by comparing it to the parent graph.

The question reads draw two complete cycles.
The Period of a trigonometric function is the horizontal length of one complete cycle.
The Sine curve,
The Sine curve,
We need to restrict or place a constraint using an appropriate condition as shown below:

Again, we can compare the restricted graphs of both the parent function and the given function for easy comprehension.
I hope it helps.
