How do you graph x ≥ -1, y ≥ -2, and 2x + y ≤ 6?
1 Answer

Aug 3, 2015
Plot each graph separately and then shade the area that satisfies all three inequalities.
Explanation:
Your equations are
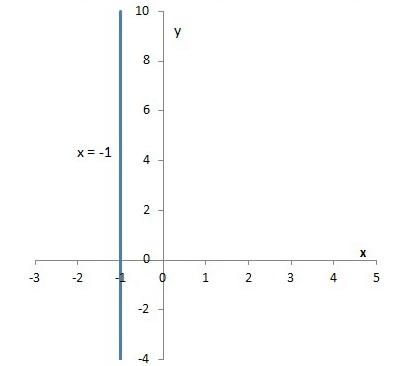
Step 1. Plot
Use a solid line because your condition is not a strict inequality.
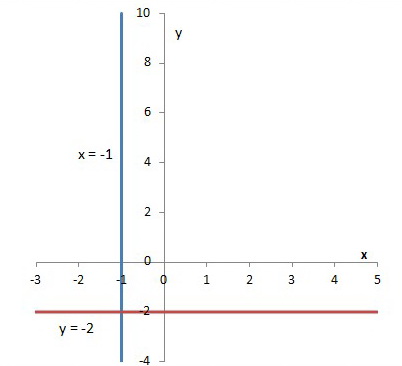
Step 2. Plot
Again, use a solid line.
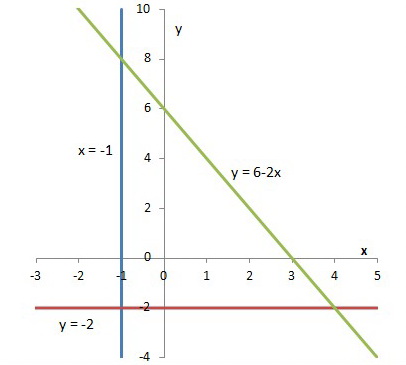
Step 3. Plot
Rearrange the equation to
Step 4. Shade the area that satisfies all three conditions.
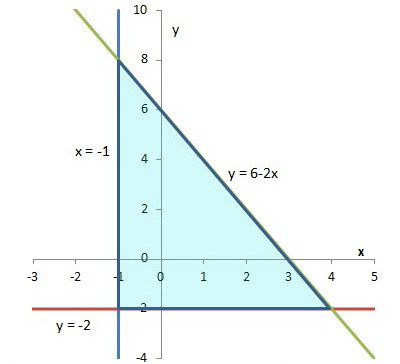
Check: Test a point in the coloured region.
Try (
∴ TRUE
∴ TRUE
∴ TRUE
The point (
