How do you graph y=1+log_4x?
1 Answer

Jul 6, 2018
Please read the explanation.
Explanation:
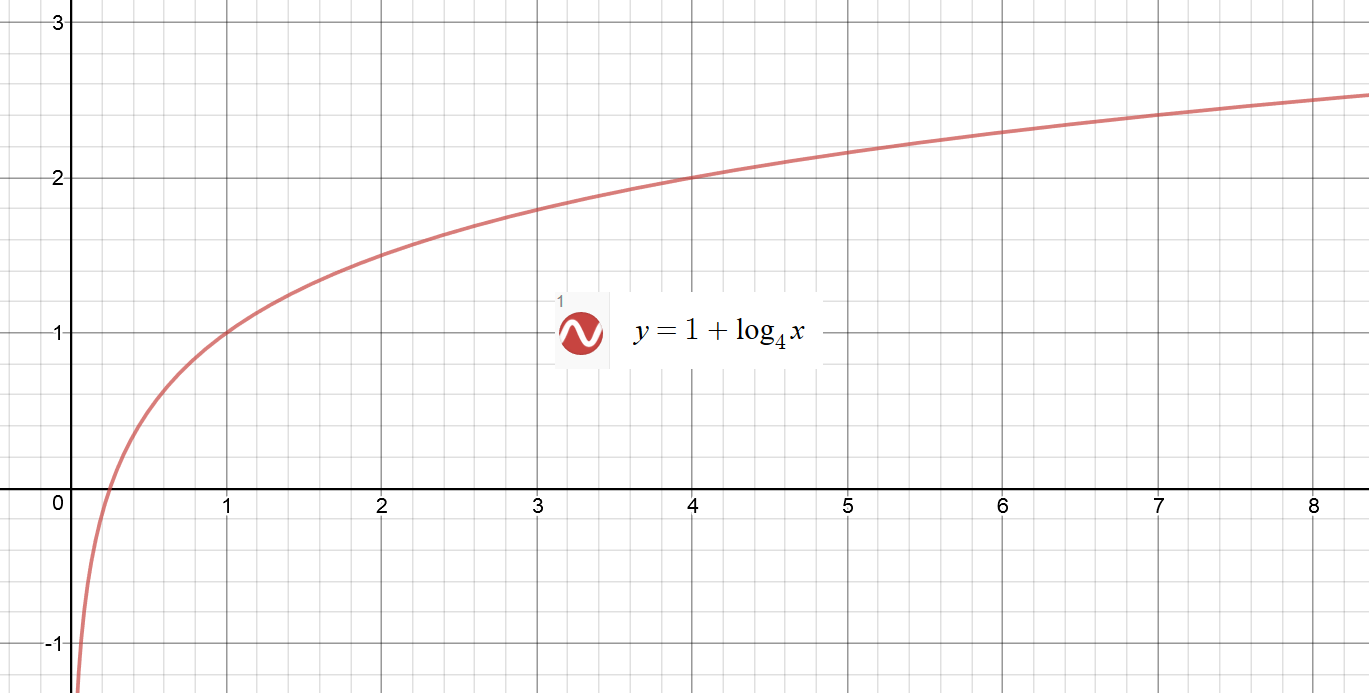
The given logarithmic function is
Logarithm of Zeros and Negative Values are undefined.
Hence, consider a few positive values for
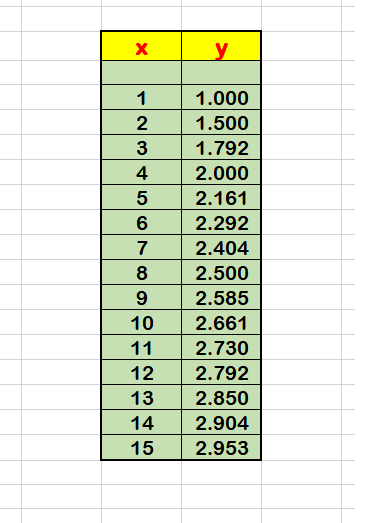
Draw a suitable graph using the data table above:
Hope you find this solution useful.
