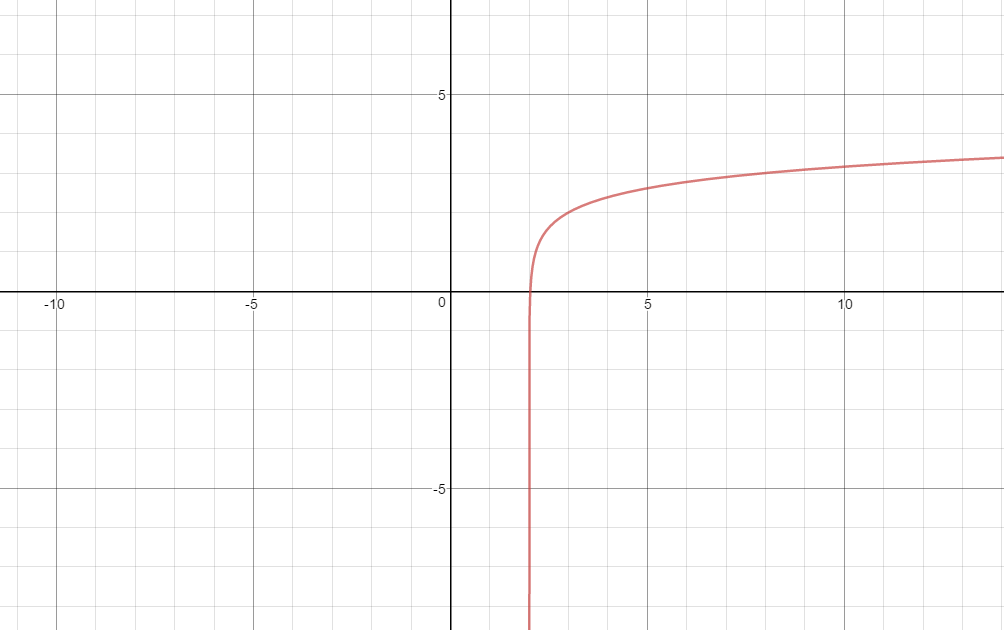
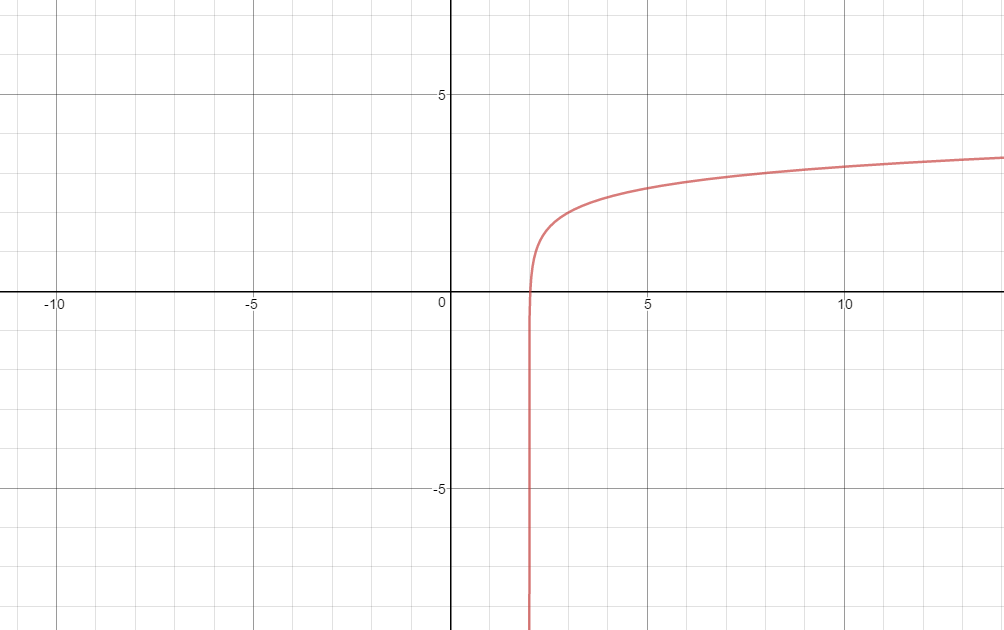
How do you graph #y=2+log_6(x-2)#?
1 Answer
Nov 9, 2016
Use the property of logarithms
Explanation:
You can convert to
And generate your table of values using a calculator or spreadsheet.
Here is a graph using the first equation:

Using the second equation:

