How do you graph #y=2/(x-1)-2# using asymptotes, intercepts, end behavior?
1 Answer

The graph should look like this: graph{2/(x-1)-2 [-10, 10, -5, 5]}
Explanation:
Let us find the horizontal asymptote.
Since the numerator variable is raised to the power of zero, and the denominator variable is raised to the power of one, the horizontal asymptote is
Therefore, the horizontal asymptote is
To find the vertical asymptote, we see which value makes the denominator zero. We see that it is one.
Therefore, the vertical asymptote is
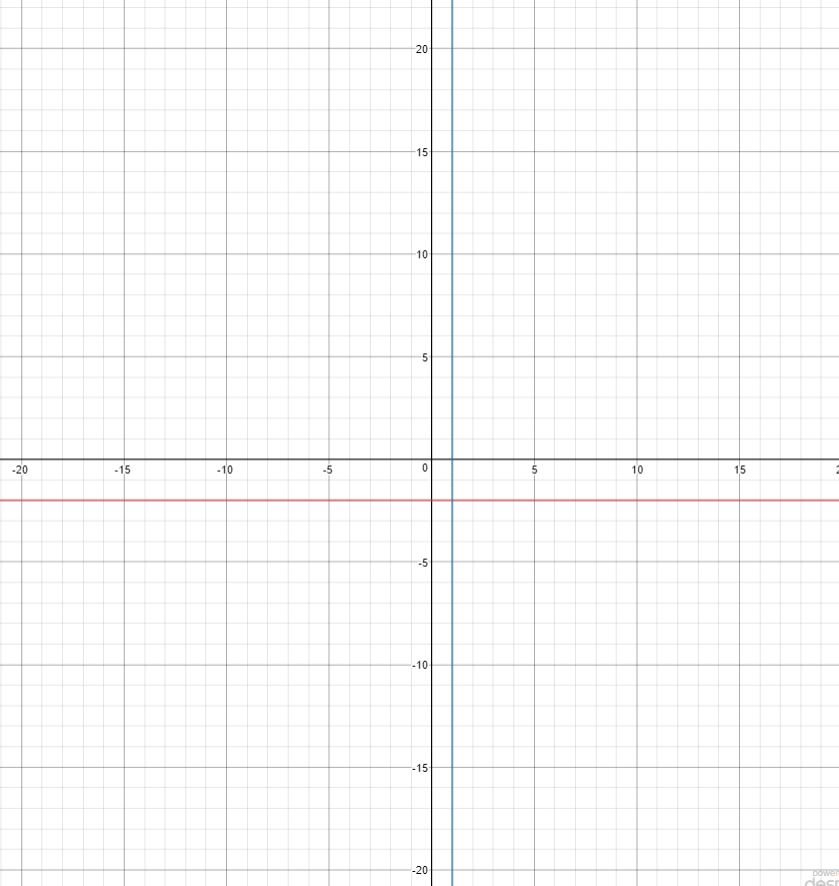
Now, we graph these two lines in a graph with a dashed line.
*Image from desmos.com
Now, we plug in some x values to the function.(Let's go for
Look at the graph to find out whether you are right or not!
graph{2/(x-1)-2 [-10, 10, -5, 5]}
We graph the points and see whether they go along nicely with our asymptotes. If they do, connect them. Remember that this one goes on forever.
If you think that these points do not go close enough to the asymptotoes, try more x values.
