How do you graph #y> -2 |x-1| + 3#?
1 Answer

Please read the explanation.
Explanation:
We are given an absolute value function:
The standard form of an absolute value function:
If
If
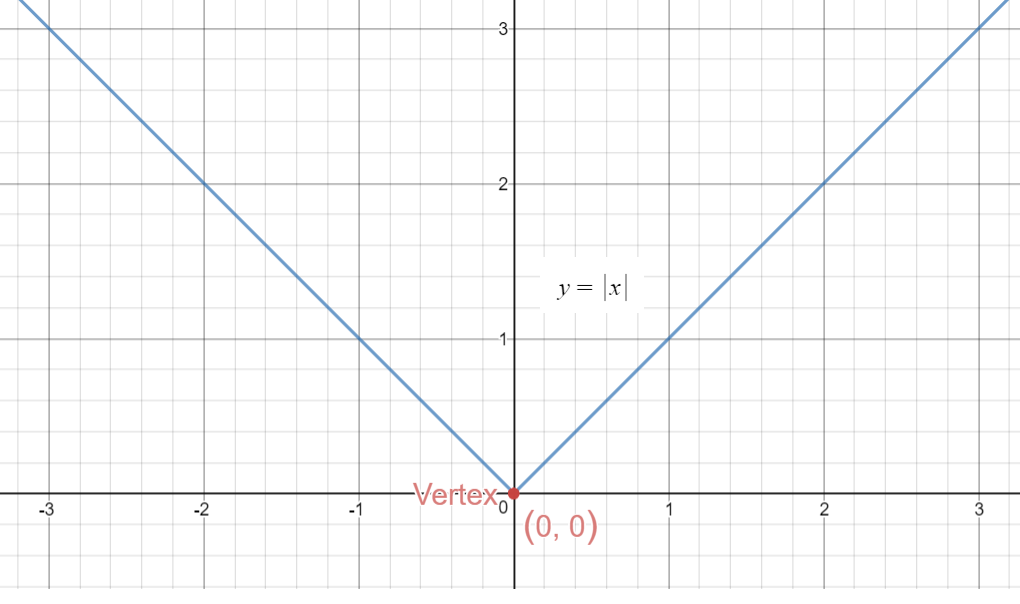
In this context,
is the Parent Function.
You will find the graph of the parent function along with the graph of the given function for easy comparison and comprehension.
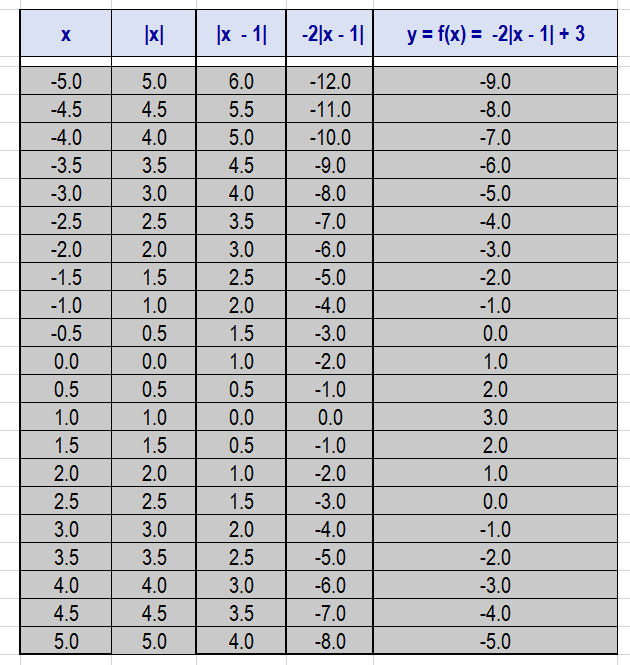
You can also find data values created for both the functions to analyze the behavior of the functions.
Let us look at the given function:
Look at the standard form:
Vertex:
Use the data table below and graph:
Graph of
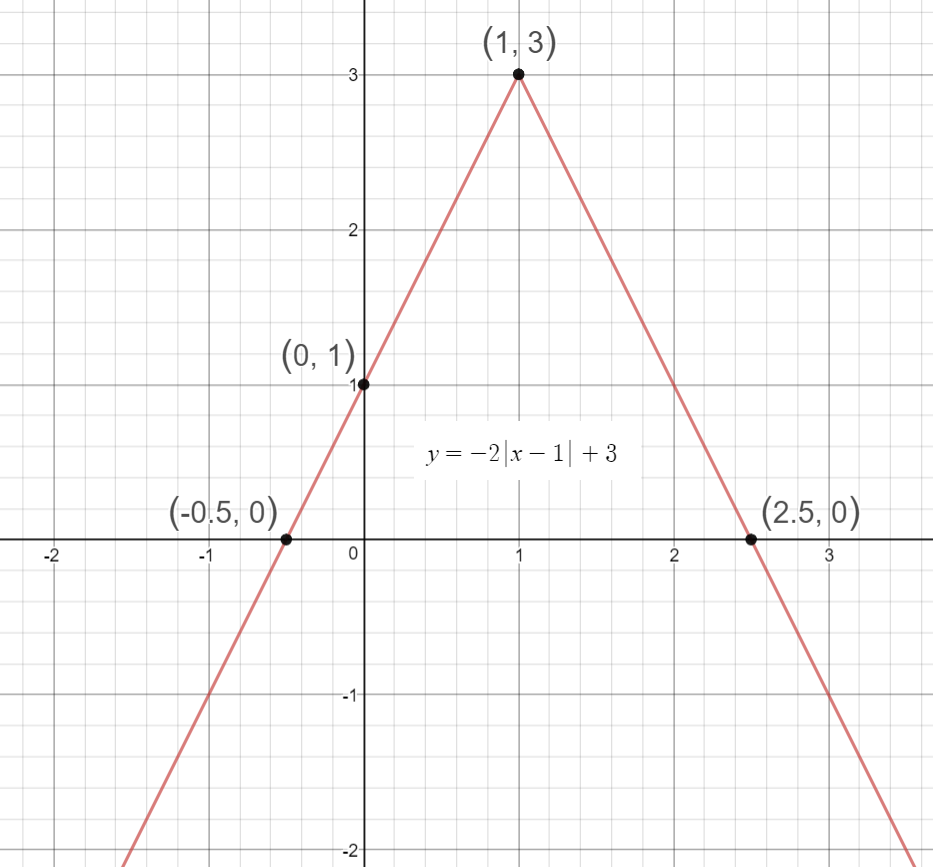
Graph of
Graph of both the functions together:
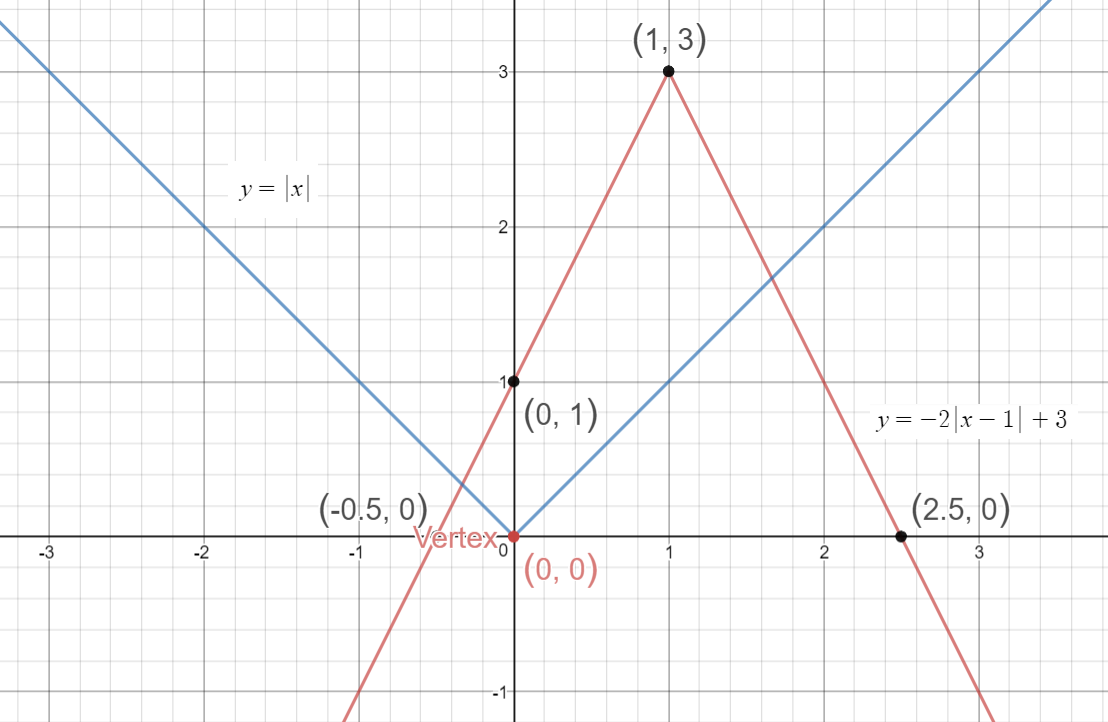
When you analyze both the graphs to understand the behavior of absolute value functions.
Vertex is at
y-intercept is at
There are two x-intercepts:
Hope you find this helpful.
