How do you graph #y=2abs(x-3)+5#?

1 Answer
Jul 7, 2015

Graph #y= 2x-1# for all points with #x>=3#
and #y = 11-2x# for all points with #x<=3#

Explanation:

Note that the y intercept at #(x,y) = (0,5)# is valid for both line segments.

Pick an arbitrary value of #x>3# (for example #x=4#)
then when #x>=3# the line goes through
#color(white)("XXXX")##(4, 2abs(4-3)+5) = (4,7)#
Draw a line segment from #(0,5)# through #(4,7)#

Pick an arbitrary value of #x<3# (for example #x=2#)
then when #x<=3# the line goes throuhg
#color(white)("XXXX")##(2, 2abs(2-3)+5) = (2,7)#
Draw a line segment from #(0,5)# through #(2,7)#

The resultant graph should look something like:
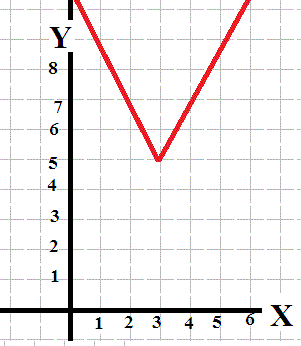
enter image source here