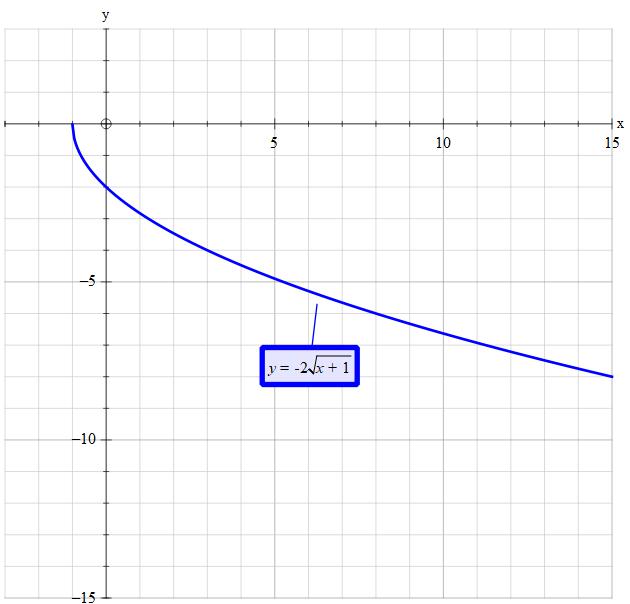
How do you graph #y=-2sqrt(x+1)#, compare it to the parent graph and what is the domain and range?

1 Answer
Jan 30, 2018

Range #->y in [0,-oo)#
Domain #-> x in [-1,+oo)#

Explanation:

For the solution not to enter the domain of complex numbers the content of the root must never be negative.

Thus the cut off is #x>=-1 #

Deriving the 'cut off point'
The #x+1# 'shifts' ( translate ) the #x# left. In that the x-intercept is:

#y=0=-2sqrt(x+1)#

#sqrt(x+1)=0#

#x=-1 #

You can manipulate the given equation in such a way that you end up with a #ul(color(red)("variant on ") +x=(-y)^2=(+y)^2#. This has the form #sub# as it is a quadratice in #y#

However, the right hand side of #y=-2sqrt(x+1)# will allways be negative so #y# will always be negative. Thus you:
#ul("only have the bottom half of the "sub) #

#color(blue)("In summery you have:")#

The parent graph of #y=x^2# is rotated clockwise #pi/2# and then translated left by 1 on the x-axis. The multiplication by 2 makes it more narrow. The negative means you only have the lower part of the form #sub# ie #y<=0#

Tony B