How do you graph y<=3absx-1?
1 Answer

See answer below.
Explanation:
Let's build it up step by step. Firstly, we will ignore the inequality and start with the simplest linear relationship
graph{x [-10, 10, -5, 5]}
To get the equivalent absolute value function, simply make all the negative x-values positive. Notice that the function is reflected in the y-axis. One way of drawing it is to just draw the right hand side of the y-axis (positive x-values) and reflect it in the y-axis.
graph{|x| [-10, 10, -5, 5]}
The first transformation to make to the original graph is to change the gradient to 3. This makes the graph steeper.
graph{3x [-10, 10, -5, 5]}
To draw the absolute version, look at
graph{3|x| [-10, 10, -5, 5]}
The second transformation is a vertical translation of -1. This just means that you shift the whole graph down by 1 unit. Hopefully you can see that the graph of
graph{3x-1 [-10, 10, -5, 5]}
Again, just draw the right half of
graph{3|x|-1 [-10, 10, -5, 5]}
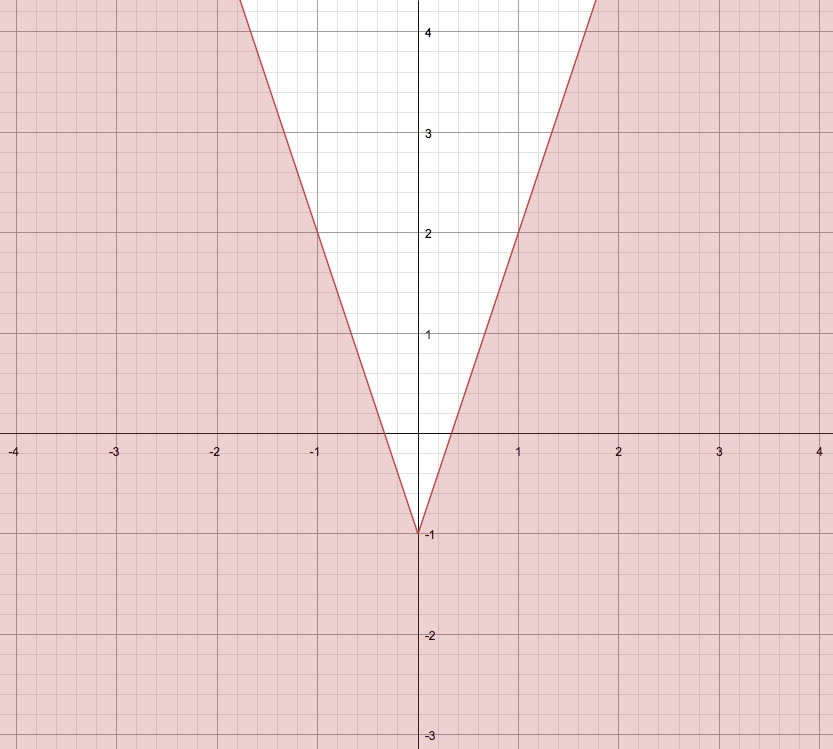
Lastly, we have to deal with the inequality. It tells us that the required y-values must be less than or equal to the line of the function. We shade the required region, which means that we want to shade the whole region under the line. Because it is less than or equal to, we use a solid line for the graph. If it was strictly just less than, we would draw a dotted line for the graph. The final answer looks like this
 https://www.mathway.com/Graph
