How do you graph y = | 3x+6|y=|3x+6|?
2 Answers

See explanantion
Explanation:
Write out a table for different values of
This means that the graph is of general shape
Write as
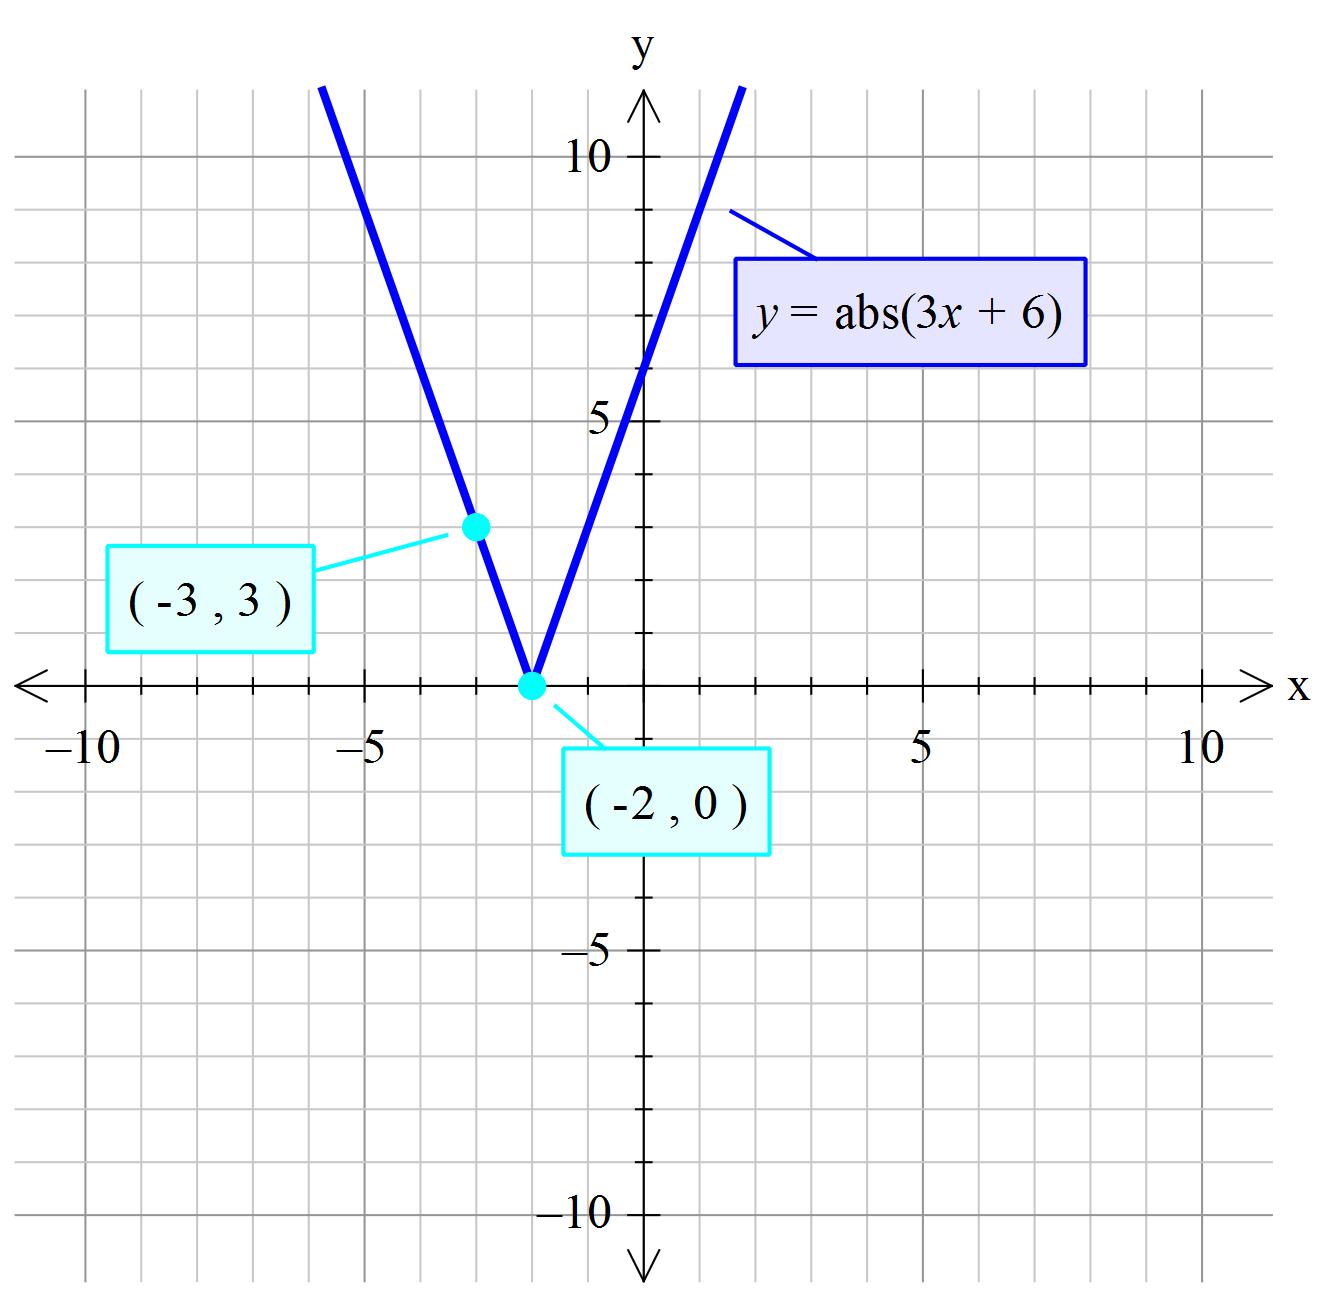
Set y to 0 giving
Divide both sides by 3
So the point of the
'~~~~~~~~~~~~~~~~~~~~~~~~~~~~~~~~~~~~~~~~~~~~~~~~~~~~~
We only
I chose one of them to be
So
'~~~~~~~~~~~~~~~~~~~~~~~~~~~~~~~~~~~~~~~~~~
I will let you determine the other one.
Explanation:
These two lines cut at
The V-like part of the pair of lines from and above the point of intersection
