How do you graph #y=-4/(x+4)+3# using asymptotes, intercepts, end behavior?
1 Answer

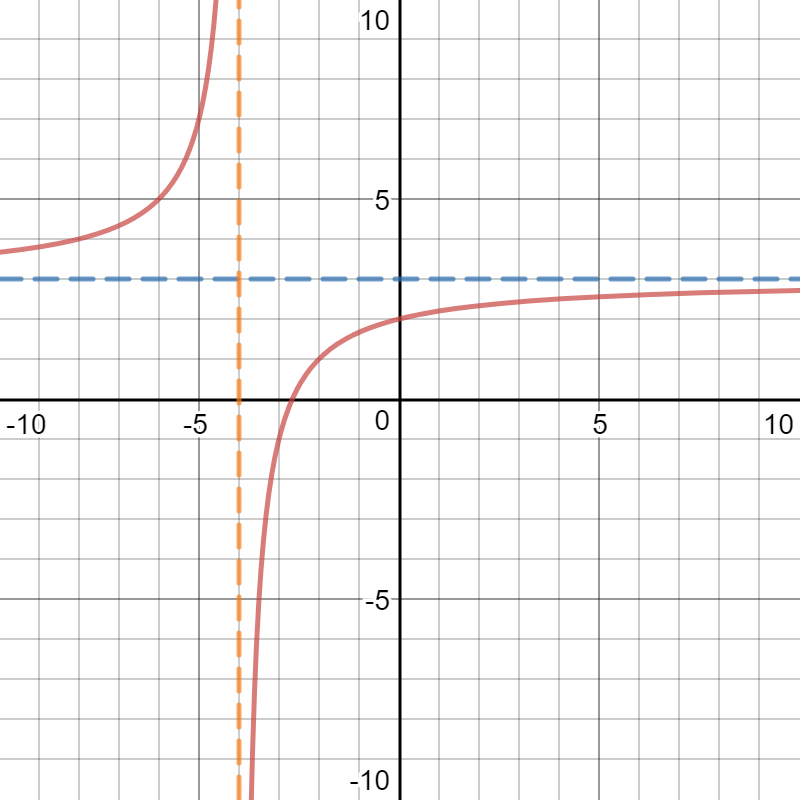
Find the asymptotes first, at x=-4 and y=3. Because the first term is negative, the left side goes up and the right side down. The graph is below.
Explanation:
You cannot divide by zero. Ever!! Google "what happens when you divide by zero" to see the world imploding. Really, you can't divide anything into zero parts. So, looking at the first term,
The horizontal asymptote for the parent function,
End Behavior: The parent function also has the right part of the graph above the horizontal asymptote, above the left part. It's like a positive slope, where the graph goes up on the right and down on the left. The
The asymptotes are shown as dashed lines, and the function you asked about is in solid red: