How do you graph #y=4absx# using a table?

1 Answer
Mar 21, 2018

enter image source here

Explanation:

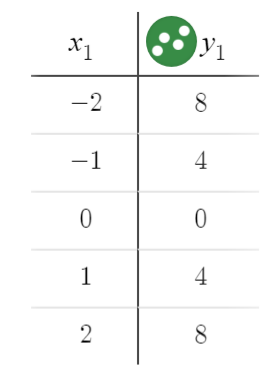
Using a table for a function is the simplest way to find out roughly #5# key points to get a general idea of how a function works.

Remember, when using an absolute value function, our #y# values will always be positive, due to the conditions #|x|#

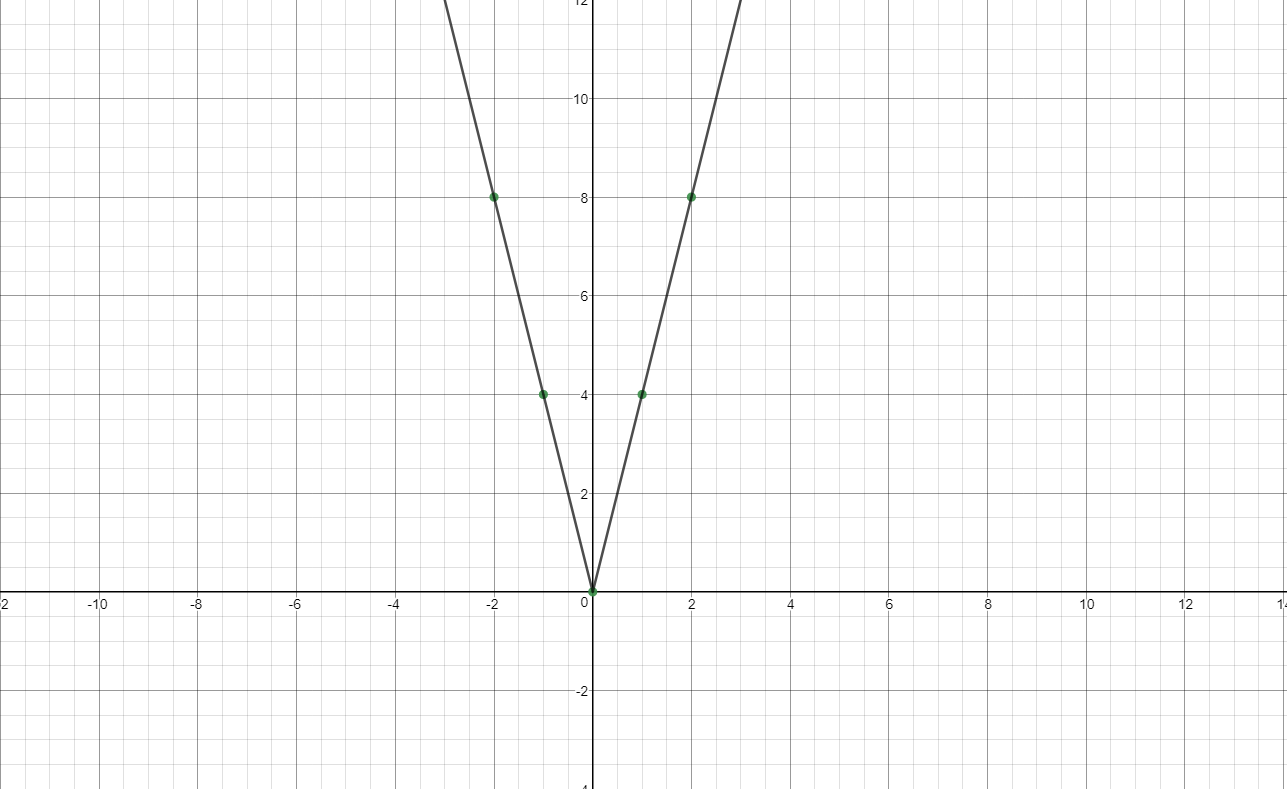
Since there are no horizontal shifts, it's a good idea to get two points left of the vertex, and right of the vertex, which is the origin #(0, 0):#

enter image source here

#f(-2)=4|-2| " becomes " f(-2)=4(2)=color(blue)8#
#f(-1)=4|-1| " becomes " f(-2)=4(1)=color(blue)4#
#f(0)=4|-0| " becomes " f(-2)=4(0)=color(blue)0#
#f(1)=4|1| " becomes " f(-2)=4(1)=color(blue)4#
#f(2)=4|2| " becomes " f(-2)=4(2)=color(blue)8#