How do you graph #y= abs(x-1)#?
2 Answers

Use a calculator table
Explanation:
Honestly it's like
First you should know what the equation actually does
The
If there is a number between
Also, if there is a number getting added or subtracted to the absolute value bars than the y axis is affected.
Any number that is added to the outside of the bars is going to make it rise that amount and vise versa for subtraction.
Lastly, if there is a negative in the very from of the equation than the graph gets flipped.
Now that you have all that down you can start picking points for you table.
I know that since the equation is
After that you need to pick two numbers on opposite sides of that point to graph it.
Since the middle is at
Once you have your two points, plug them into the equation:
And
Now you know that
To plot just follow the coordinates
Just a tip, anything with absolute value bars is going to be a V so if it's not you did something wrong.

Please read the explanation.
Explanation:
This function is an Absolute Value Function.
An absolute value function is a function that contains an algebraic expression within absolute value symbols
Please remember that the absolute value of a number is its distance from 0 on the number line.
So the absolute value of both
To graph an absolute value function, choose several values of x and find some ordered pairs.
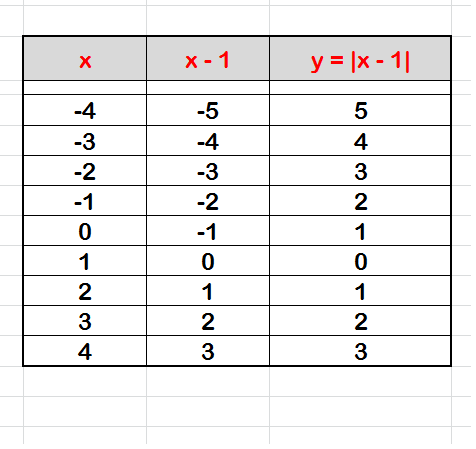
Plot the points on a coordinate plane and connect them.
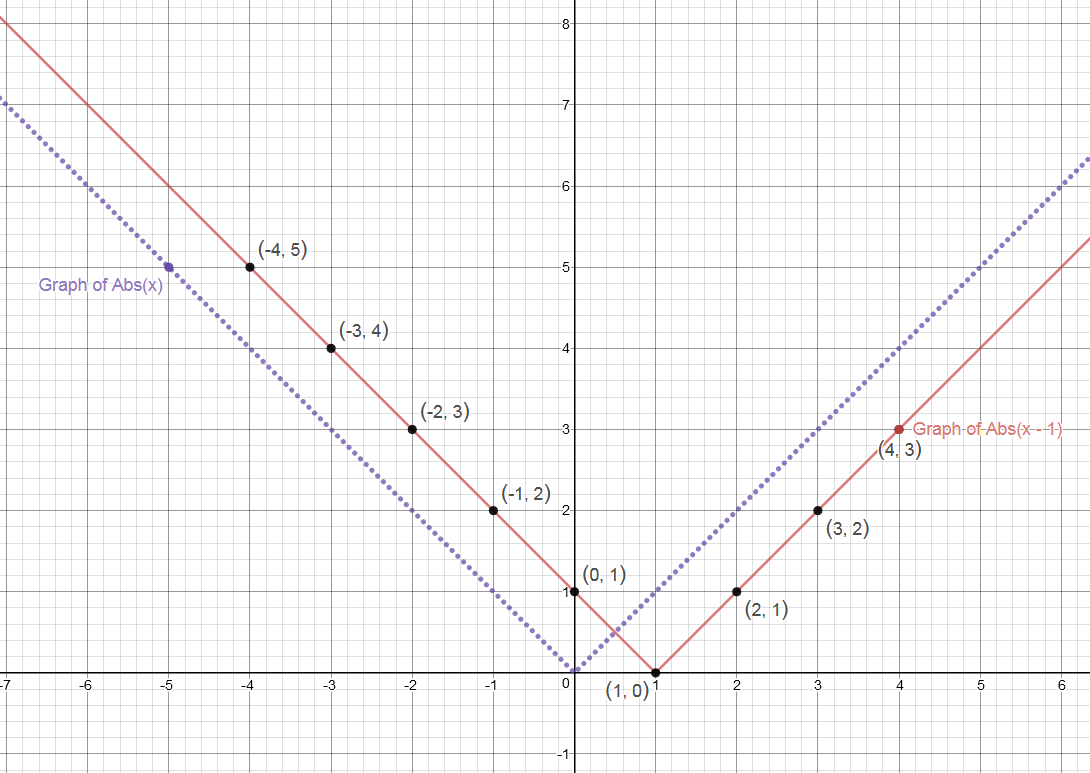
The Parent function
You can understand how the graph of
Use the function
When
Hence, notice that the vertex is now
Hope it helps.
