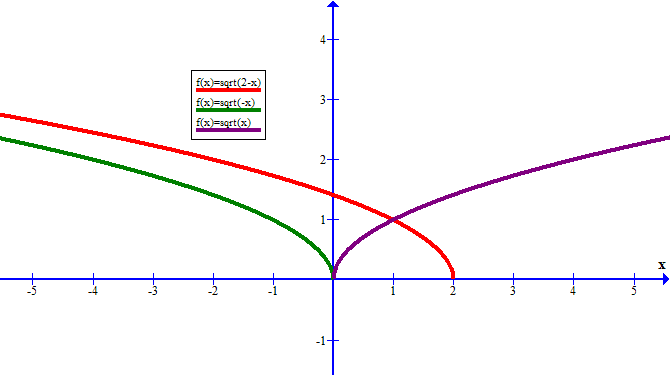
Note that #color(purple)(hatx)# is the same as #color(green)((-barx))# except that all #color(purple)(hatx)# values are the negative of their corresponding #color(green)(barx)# values. That is #color(green)(-barx)# is the reflection of #color(purple)(hatx)# through the Y-axis.
#color(red)(2-x)# takes every value #color(green)(barx)# and increases it by #color(red)2#, effectively shifting all points 2 units to the right.
Provided you know how to draw #color(purple)y_(hatx)=sqrt(hatx)#
graphing this function should be straight forward if you just perform the reflection and shift.


